
FIGURE 1-4.
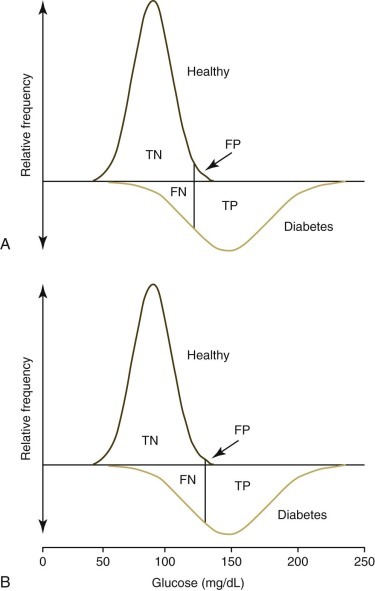
Frequency diagrams of a healthy dog population compared with a population of dogs with type 2 diabetes mellitus. Graphs are redrawn from Figure 1-3 to demonstrate true-negative (TN), false-negative (FN), true-positive (TP), and false-positive (FP) values used to calculate sensitivity, specificity, and predictive values. The top graph (A) demonstrates the effect of using the mean +2 standard deviations (SD) to set the upper limit of the reference interval. The lower graph (B) demonstrates the effect of using the mean +3 SD to set the upper limit. The number of FP tests are reduced but the number of FN tests are increased by using the higher reference limit.
The figure is redrawn from Farver TB. Concepts of normality in clinical biochemistry. In: Kaneko JJ, Harvey JW, Bruss ML, eds. Clinical Biochemistry of Domestic Animals. 6th ed. San Diego: Academic Press; 2008:1-25.