
Figure 3:
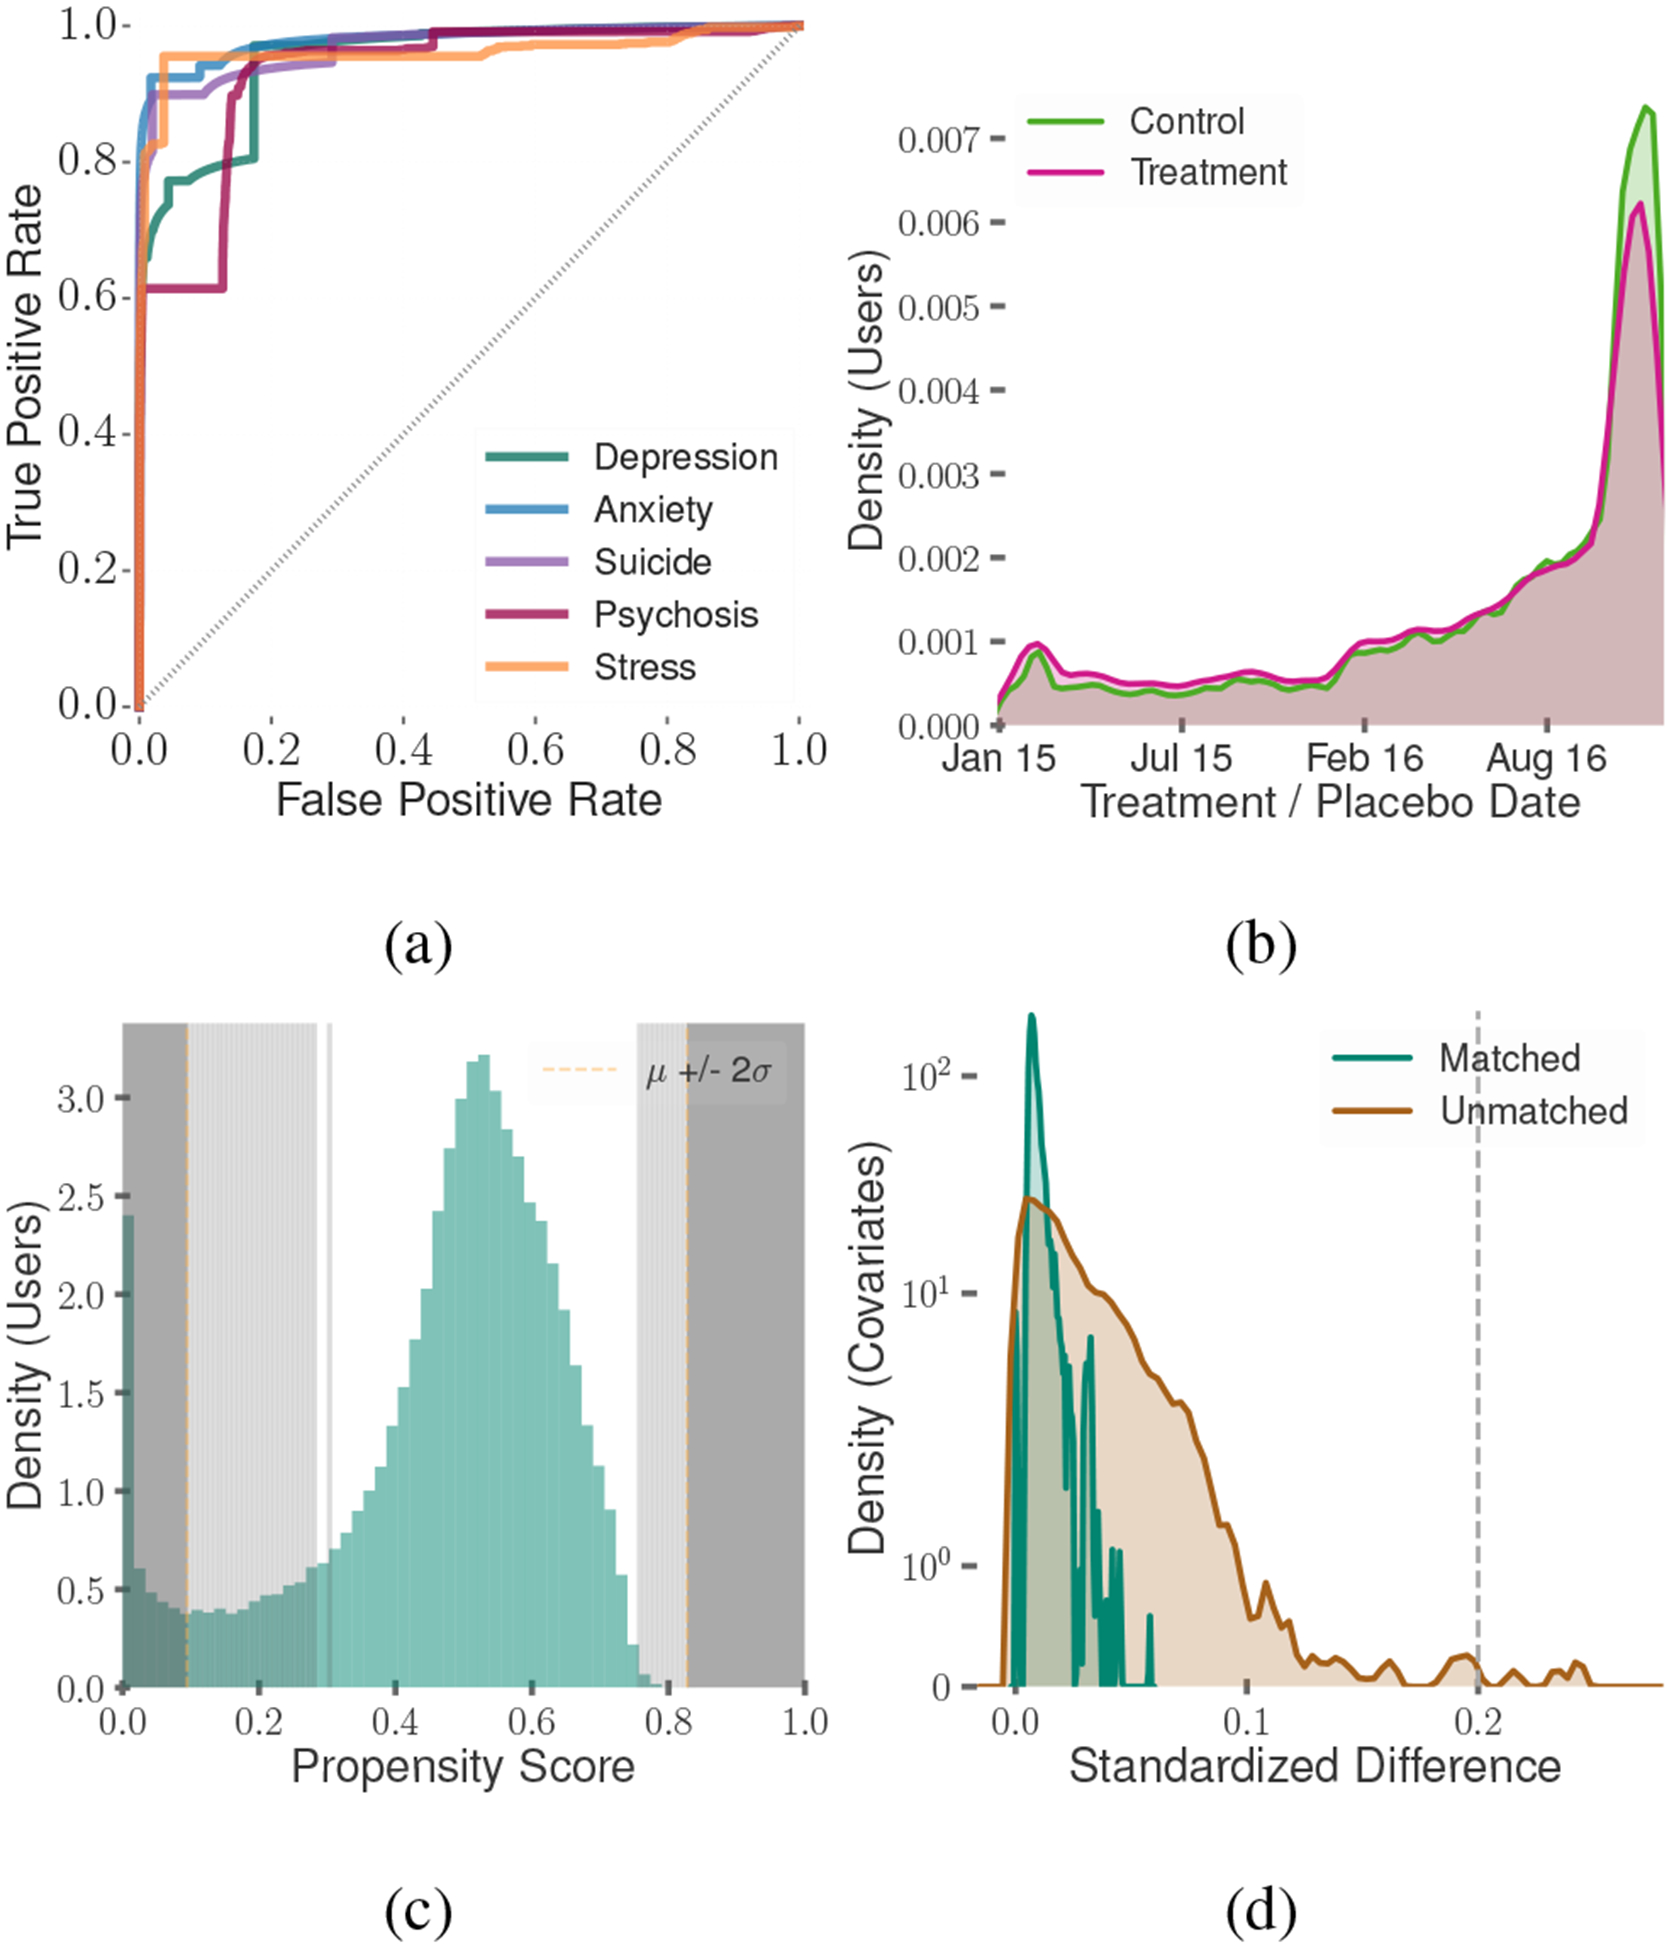
(a) ROC curves of the classifiers that measure symptomatic outcome, (b) Treatment dates distribution, (c) Propensity score distribution (shaded region represents those dropped in our analysis), (d) Quality of matching
Official websites use .gov
A
.gov website belongs to an official
government organization in the United States.
Secure .gov websites use HTTPS
A lock (
) or https:// means you've safely
connected to the .gov website. Share sensitive
information only on official, secure websites.
(a) ROC curves of the classifiers that measure symptomatic outcome, (b) Treatment dates distribution, (c) Propensity score distribution (shaded region represents those dropped in our analysis), (d) Quality of matching