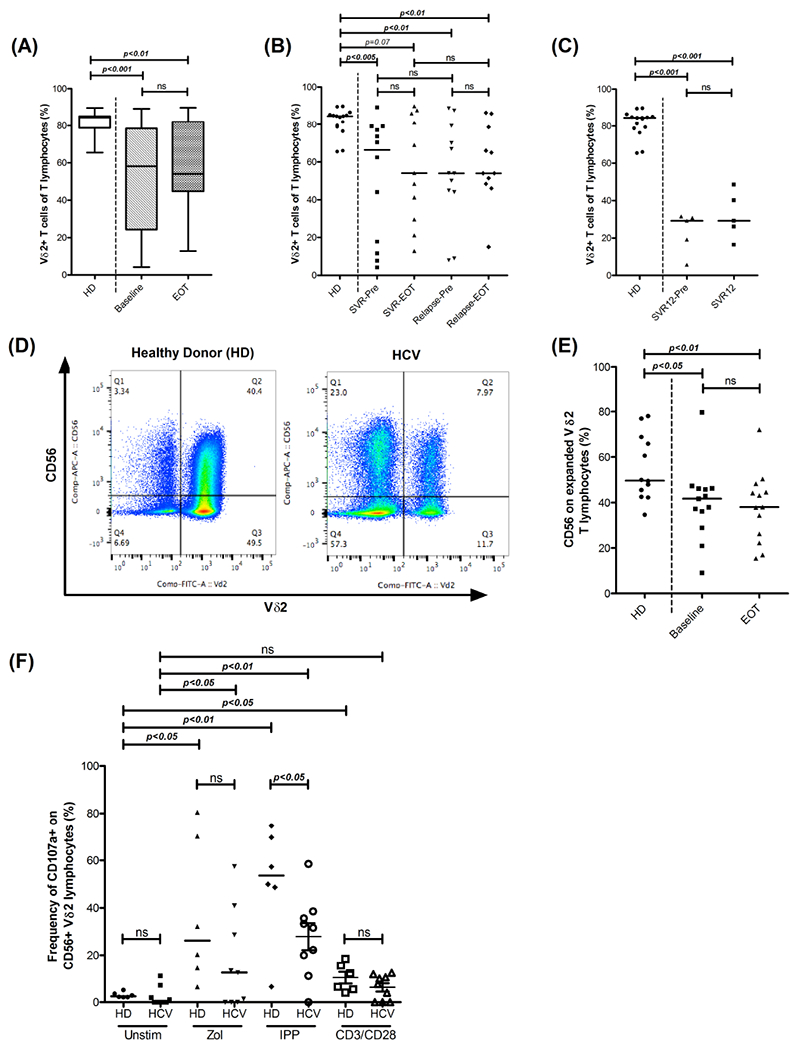
Figure 3: Vδ2-T cell proliferative response to Zoledronate is impaired in CHC and persists after virus clearance.

(A) Representative dot plots depicting CD56 expressing cytotoxic Vδ2-T cells after expansion in response to Zoledronic acid and IL2. (B) Box plot representing frequency of expanded Vδ2-T cells in HDs (N=15) and HCV-Pre (N=24) and HCV-EOT (N=22). Box encompasses interquartile range (IQR) and horizontal line dividing the box indicates median value. (C) Frequency of expanded Vδ2-T cells in HDs (N=15) and in SVR (N=12 and N=11 at baseline and EOT respectively) and Relapsed (N=12 and N=11 at baseline and EOT respectively) groups. (D) Frequency of expanded Vδ2-T cells in HDs (N=15) and at baseline (SVR12-Pre, N=5) and 12 weeks follow up (SVR12, N=5) in HCV patients treated for 12week with DAA. (E) Frequency of CD56 expressing expanded Vδ2-T cells in HDs (N= 12), HCV-Pre (N=13) and HCV-EOT (N=13). Horizontal bar indicates median value. Paired t test or Wilcoxon matched-pairs signed rank test were used for comparisons between the groups Baseline and EOT, SVR-Pre and SVR-EOT, Relapse-Pre and Relapsed-EOT and SVR12-Pre and SVR12 in (A), (B), (C) and (E). In (B), Kruskal-Wallis non-parametric test and Dunn’s post-hoc test to control for multiple comparisons was performed for the comparison among the groups (SVR-Pre, Relapse-Pre and HD) and (SVR-EOT, Relapse-EOT and HD). Wilcoxon matched-pairs signed rank test were used in (F) for comparisons among groups with different stimulant in HD and HCV groups. Mann Whitney test was used for rest of the comparisons. ns= not significant.
