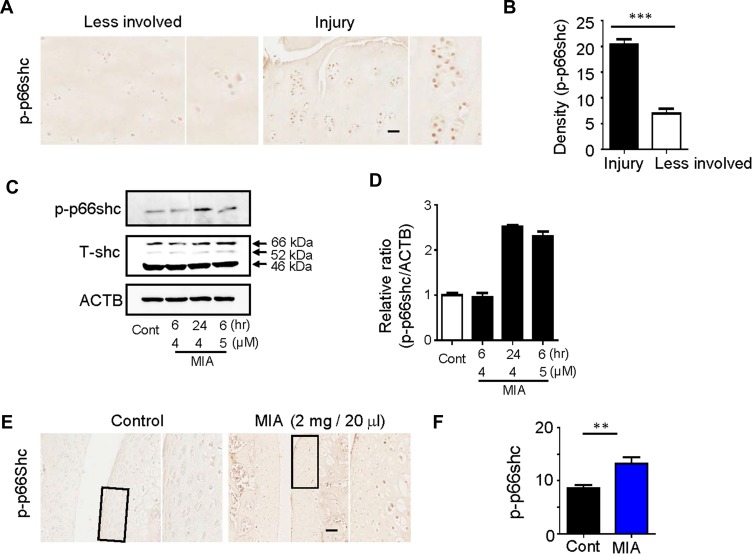
Figure 2.
Expression of p66shc in articular cartilage from OA patients and MIA-induced rat models.
Notes: (A, B) p-p66shc was prominently expressed at sites of injury. Scale bar = 50 µm. ***P < 0.001 (C, D) p-p66shc and total shc protein levels were detected via Western blotting, and the p-p66shc/ACTB ratios were determined using Image J software. (E, F) Expression levels of p66shc in knee cartilage as measured with immunohistochemical staining. Protein density was quantified using Image J software (NIH, USA). Scale bar = 50 µm. **P < 0.01.
Abbreviations: OA, osteoarthritis; MIA, monosodium iodoacetate; ACTB, actin beta.

