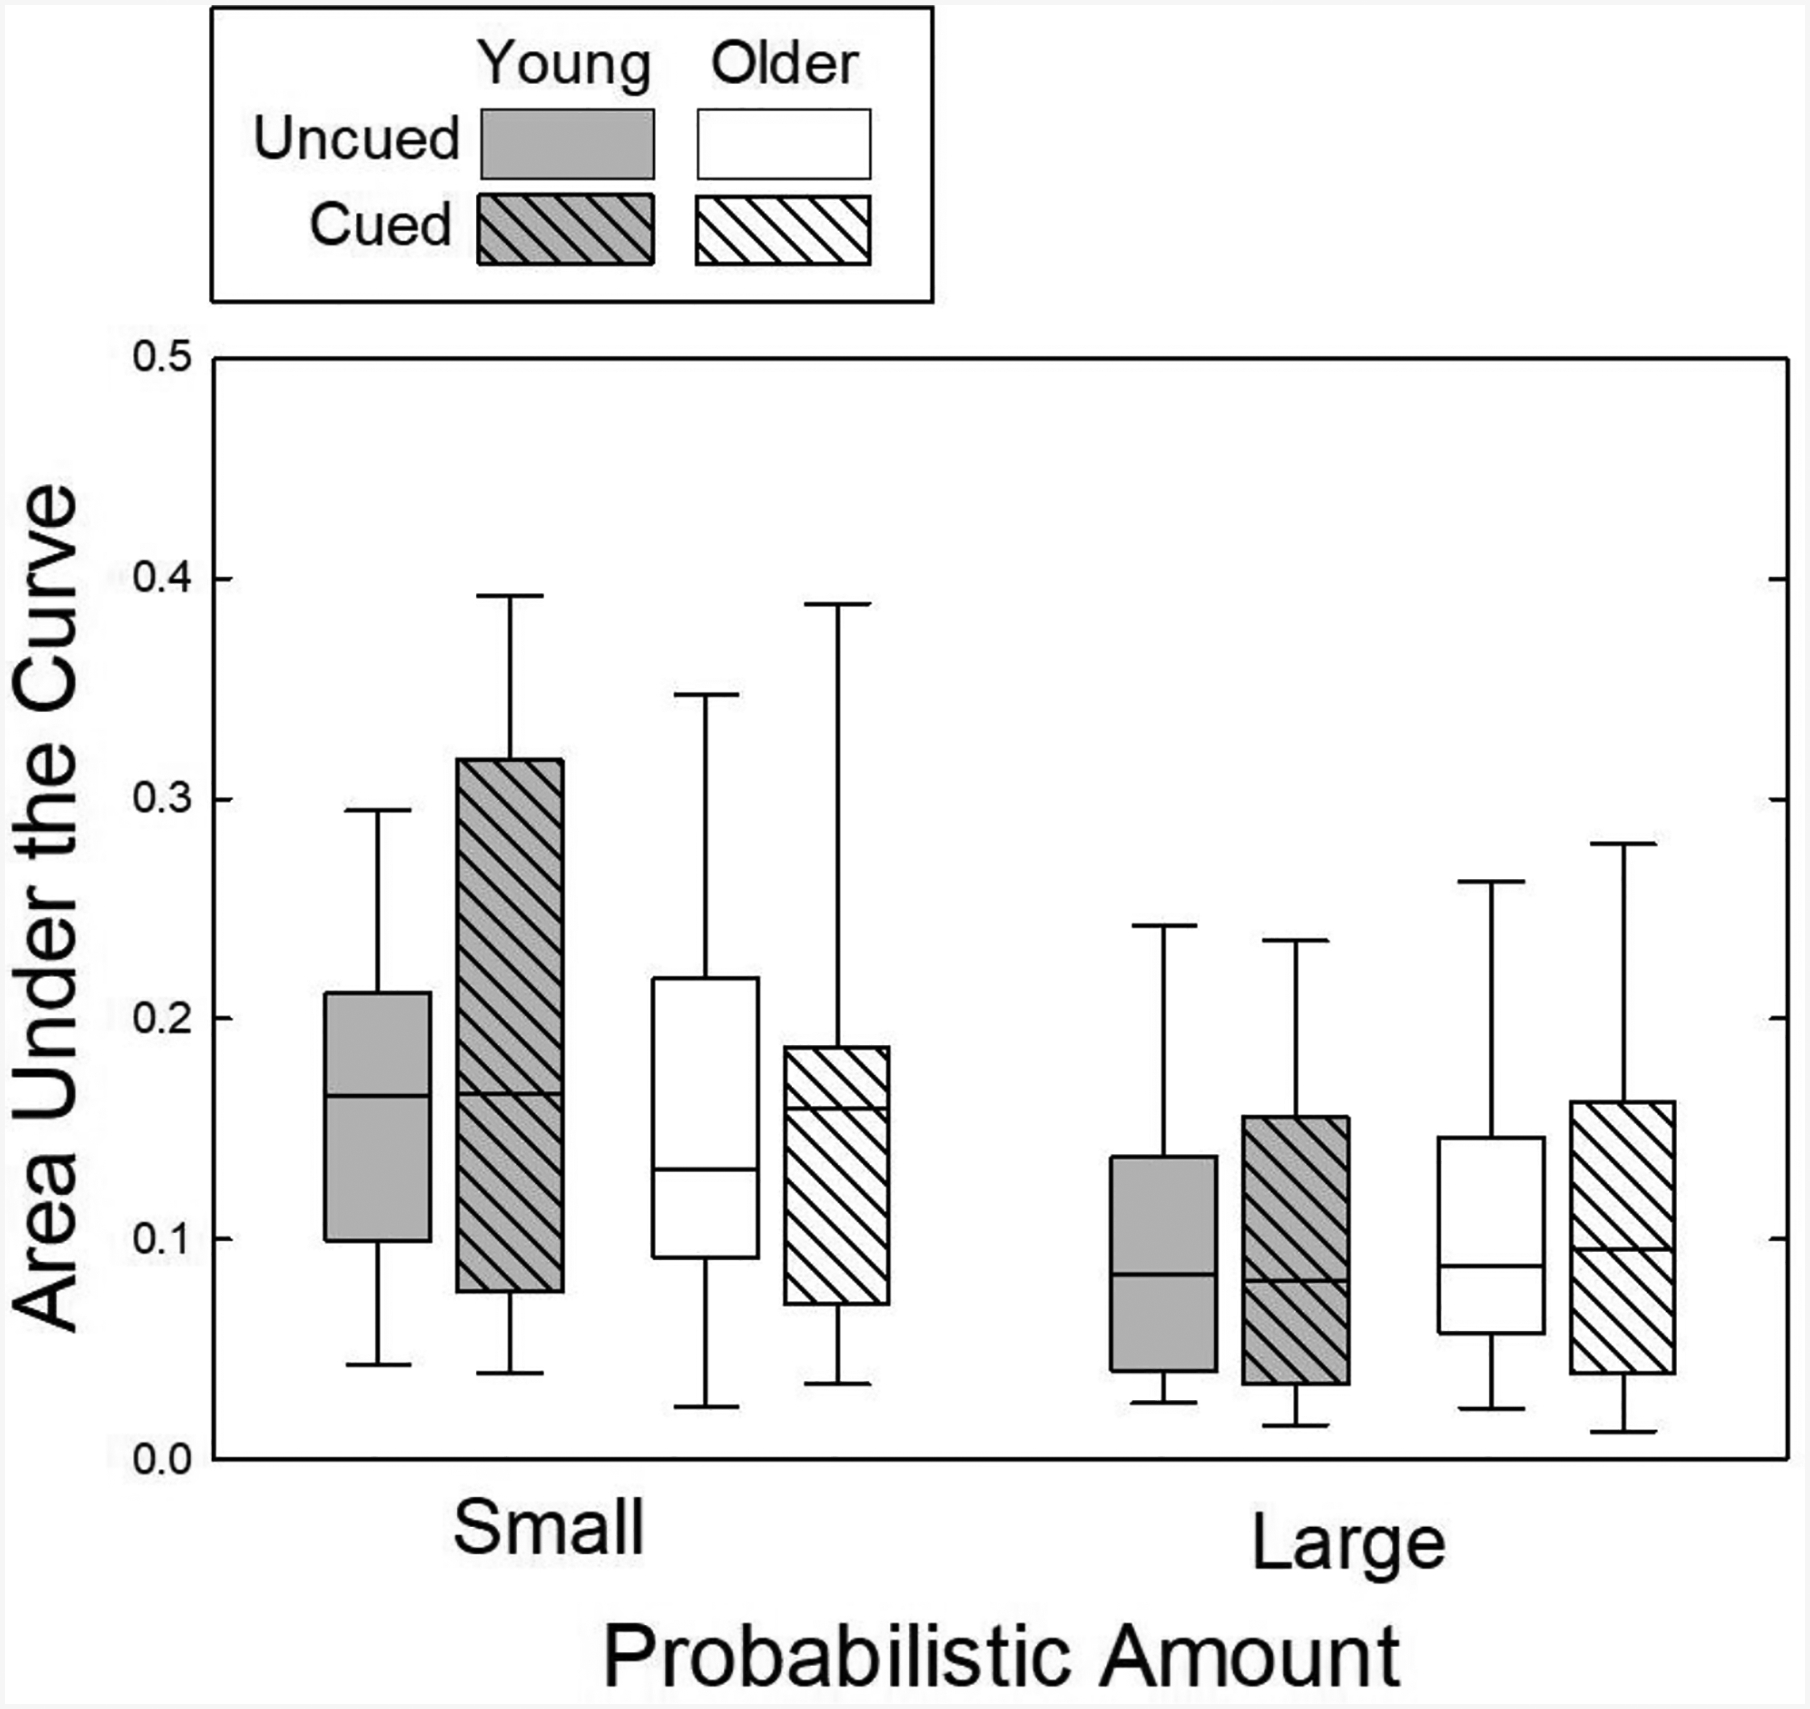
Figure 6.

Box plots depicting the distributions of AuCs for the young and older adults in all four conditions (small and large probabilistic rewards in the uncued and cued conditions) of Experiment 2. The bottom and top of each box represents the 25th and 75th percentiles; the horizontal line represents the median AuC; the bottom and top whiskers extend to the 10th and 90th percentiles.
