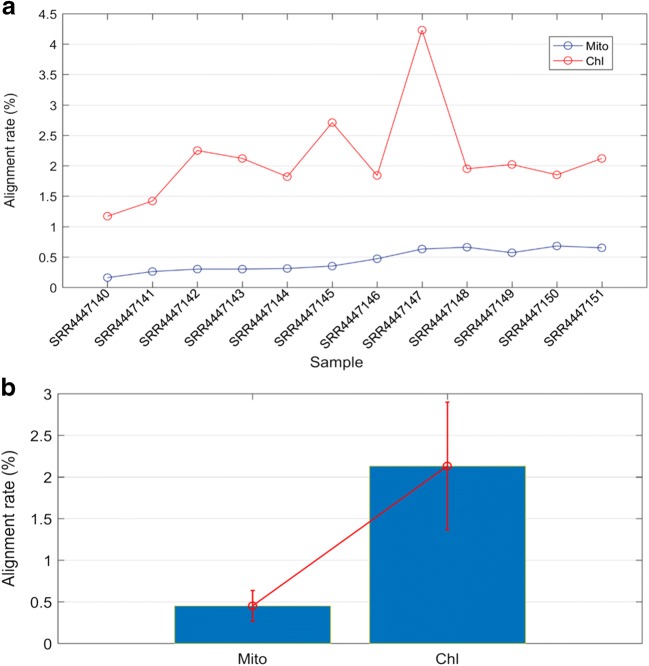
Fig. 1.
The mapping rates of transcriptome data to mitochondrion and chloroplast genomes. a The statics of reference-guided mapping rate. The y-axis represents mapping rate of each sample, and the x-axis represents each sample. b The bar figure of the statics of reference-guided mapping rate. The y-axis represents mapping rate of each sample, and the x-axis represents organelle (Chl: chloroplast; Mito: mitochondria)

