Fig. 1.
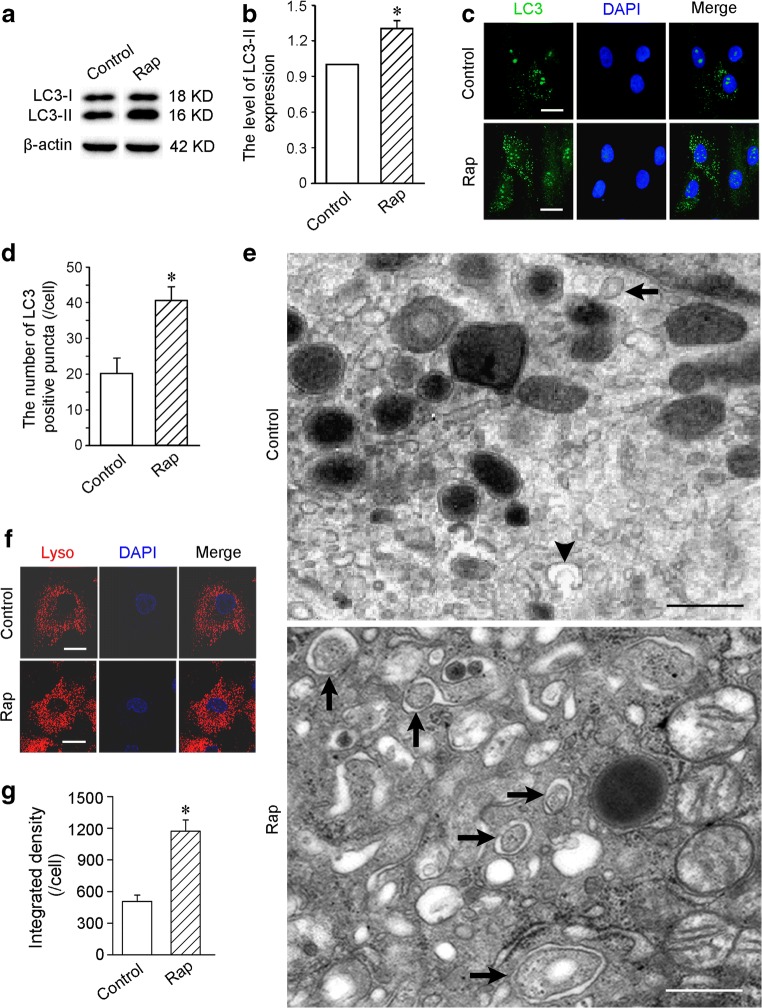
The changes of LC3 expression and autophagic structures. After treatment with 50 nmol/L rapamycin for 2 h, autophagic activities of the cells are activated significantly. a The levels of LC3-I and LC3-II expression. Western blot. b Statistic result of the level of LC3-II expression. c LC3-positive puncta. Scale bar = 20 μm. d Statistic result of LC3-positive puncta. e Representative autophagic ultrastructures. Arrowhead and arrows indicate autophagosome precursor and autophagosomes with double membranes respectively. Scale bar = 500 nm. f Lysosomes labeled with LysoTracker Red. Scale bar = 10 μm. g Statistic result of the fluorescent density of lysosomes. n = 3. *p < 0.01 versus control group. Rap, rapamycin

