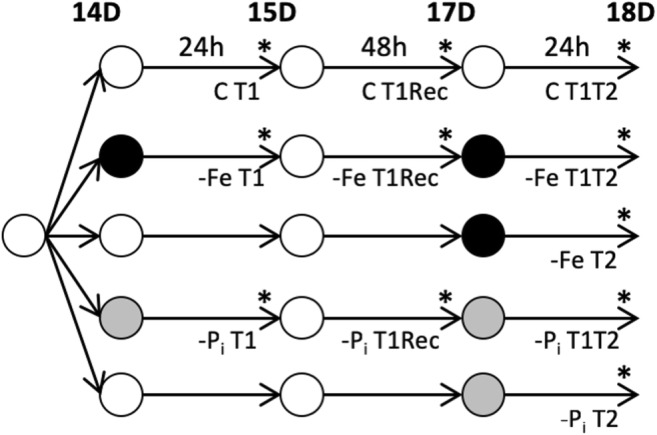
Fig. 1.

Experimental design to examine repeated short-term nutrient deficiency stress on gene expression. After 7 days on germination paper, plants were moved to optimal (white) nutrient solution for 7 days. On day 14, plants were moved to one of three new nutrient solutions: optimal (white), –Fe (black), or –Pi (gray) for 24 h at which time, roots and leaves of a subset of plants were collected separately (T1). Sample times are indicated with an asterisk (*). All remaining plants were moved to new optimal solutions for 48 h at which time, samples from T1Rec plants were collected. After T1Rec collection, all remaining plants were again moved to new solutions for 24 h at which time, tissue from all remaining plants was collected. In total, there were five groups of plants: group 1, control (C); group 2, –FeT1, –FeT1Rec, and –FeT1T2; group 3, –FeT2; group 4, –PiT1, –PiT1Rec, and –PiT1T2; and group 5, –PiT2. These groups yielded 22 unique samples, 11 from roots and 11 from leaves. Sample names (minus the tissue designation) are listed under the harvest timepoint and are as follows: CT1, CT1Rec, CT1T2, –FeT1, –FeT1Rec, –FeT1T2, –FeT2, –PiT1, –PiT1Rec, –PiT1T2, and –PiT2
