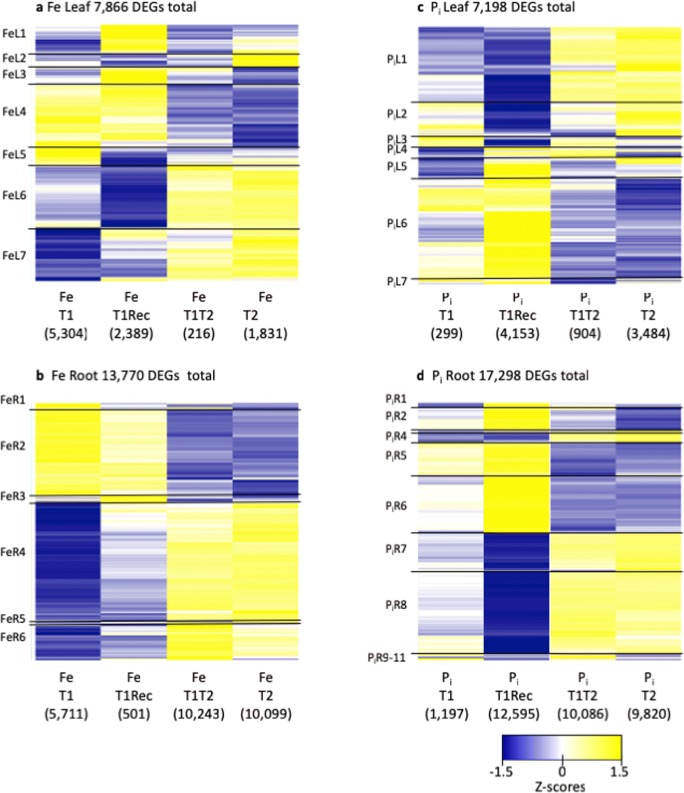
Fig. 3.
Gene expression of all differentially expressed genes identified. Expression profiles (as Z scores) of all differentially expressed genes from –Fe leaves (a) and roots (b) and from –Pi leaves (c) and roots (d). Genes upregulated compared to control plants are yellow, and those downregulated compared to control are blue. The total number of genes differentially expressed in each tissue is provided above each heatmap while the number of differentially expressed genes at each timepoint is provided in parentheses below each column. Genes sharing similar expression patterns were identified, and gene cluster designations are provided to the left of each heatmap with the boundaries of each cluster denoted by horizontal black lines

