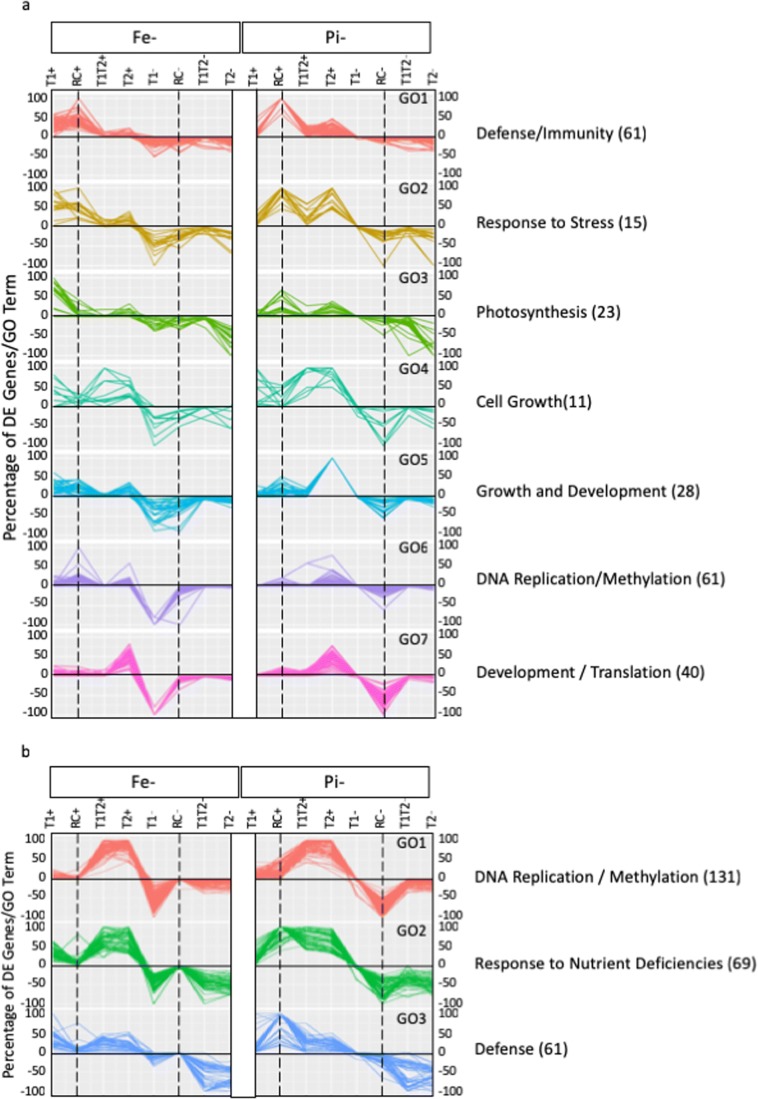
Fig. 4.
Prevalence and pattern of overrepresented Gene Ontology (GO) terms. The percentage of differentially expressed genes at each timepoint associated with GO clusters. Seven clusters were identified for overrepresented GO terms from leaves (a), and three were identified for terms from roots (b). Each line represents a unique GO term overrepresented in at least one of the timepoints. Biological processes were assigned to each cluster based on the prevalence of the top five (leaves) or ten (roots) overrepresented GO terms for each cluster. These terms are provided on the right. The total number of overrepresented GO terms within each cluster is provided in parentheses following the cluster annotation. Unique patterns for –Fe and –Pi deficiency stress and the shift in timing of DEGs associated with each GO term can be observed. Vertical dashed lines highlight the T1Rec timepoints to assist with between-clusters comparisons

