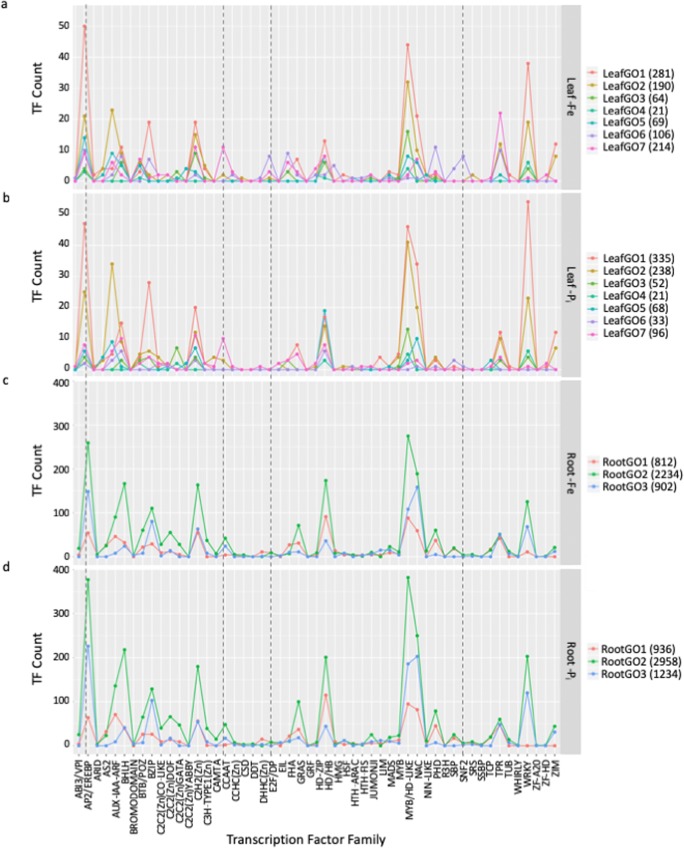
Fig. 7.
Identifying transcription factors (TFs) associated with Gene Ontology (GO) terms. The number of differentially expressed TFs by transcription factor family (TFF) and GO cluster in leaves and roots The color of the lines corresponds to the GO clusters in Fig. 4. This analysis identifies individual TFs from a single TFF associated with different biological processes as described by the GO clusters. TFFs present in –Fe leaves, but not –Pi leaves include SNF2 and E2F (highlighted with a vertical dashed line). More TFs are DE in roots, but patterns between –Fe roots and –Pi roots are similar

