
Figure 2.
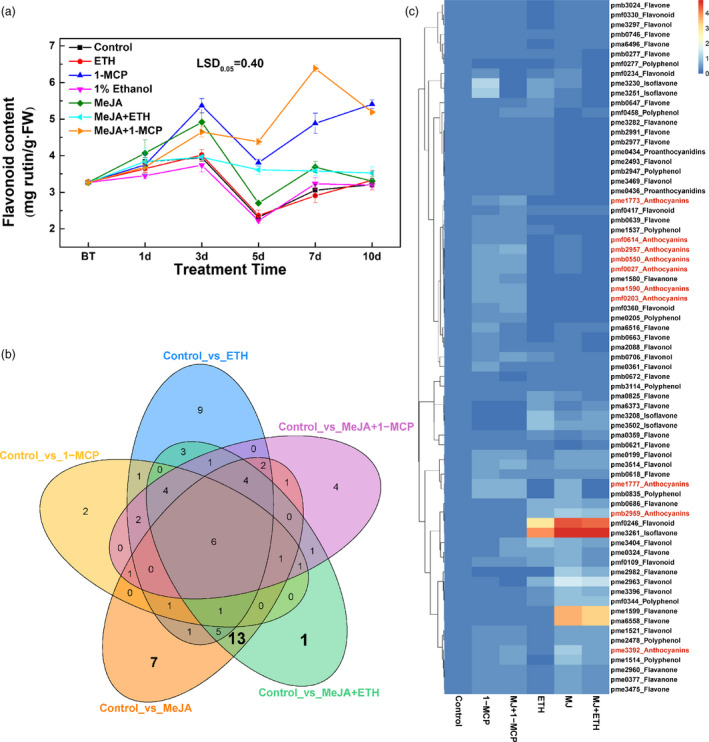
Effects of various treatments on flavonoid biosynthesis in ‘Hongzaosu’ pear fruits. (a) Total flavonoid contents of ‘Hongzaosu’ pear fruits following diverse treatments. (b) Venn diagram of differentially accumulated flavonoid metabolites in each sample pair. (c) Heat map indicating the relative flavonoid contents. The corresponding flavonoids for the index are listed in Table S2. Data are presented as the mean ± standard error of three biological replicates.