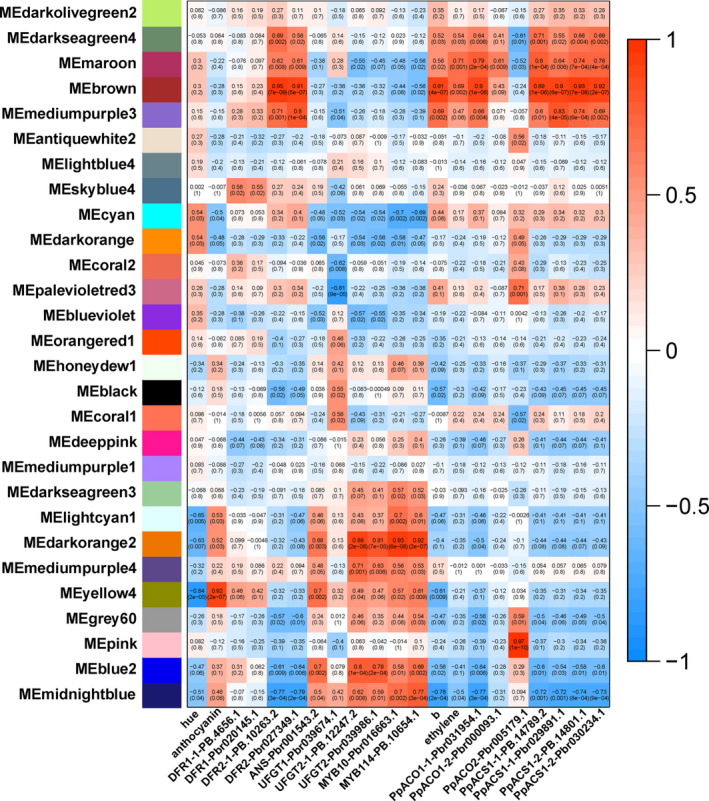
Figure 6.

Identification of transcripts by the weighted gene co‐expression network analysis (WGCNA) of hormone‐treated ‘Hongzaosu’ pear fruit peels. Module–trait correlations and the corresponding P‐values are in parentheses. The left panel presents the 28 modules. The colour scale on the right presents the module–trait correlations from − 1 (blue) to 1 (red). The panels “hue”, “anthocyanin”, “b”, and “ethylene” represent the hue angles, anthocyanin contents, b* values and ethylene‐release rates, respectively. The other panels represent the changes in gene expression levels.
