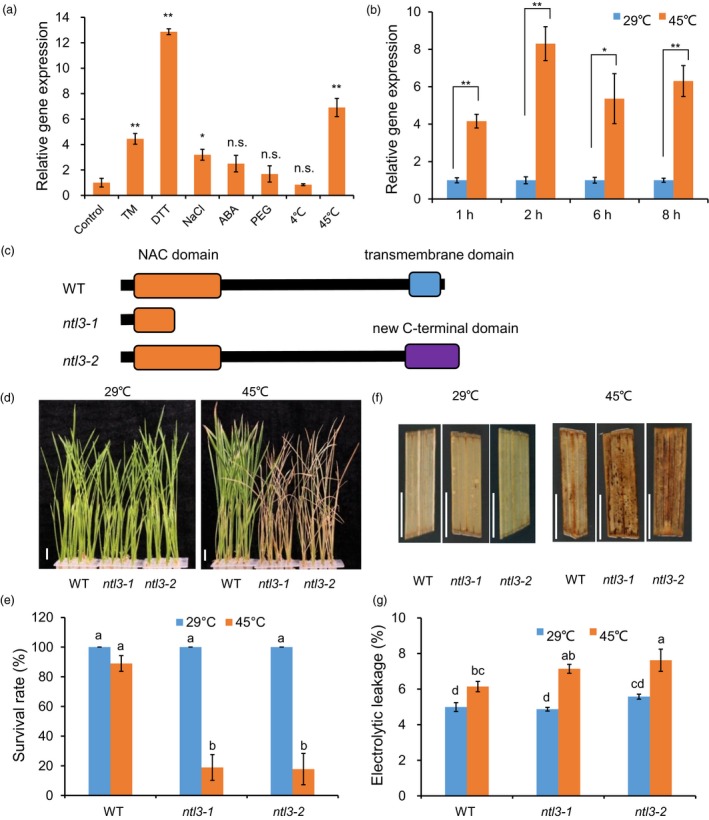
Figure 1.

Loss‐of‐function of OsNTL3 confers heat stress sensitivity in rice. (a–b) Up‐regulation of OsNTL3 by ER stress and abiotic stresses. Eight‐day‐old wild‐type rice Nipponbare seedlings were treated with various stresses (TM, 5 μg/ml; DTT, 2 mm; NaCl, 250 mm; ABA, 0.1 mm; PEG 4000,15%) for 4 hr and roots were harvested for OsNTL3 expression analysis (a). Time‐course experiments were performed under heat stress conditions (b). Relative gene expression is the expression level of OsNTL3 in stressed plants relative to that in non‐stressed plants, both of which were normalized to that of the internal control ACTIN. Error bars represent SE (n = 3). Asterisks indicate significance levels when comparing to the control in t‐test. (*, P < 0.05; **, P < 0.01; n.s., not significant at P < 0.05). (c‐e) Heat stress phenotypes of the OsNTL3 mutant plants. Eight‐day‐old wild‐type (WT) seedlings and two lines of targeted‐gene‐edited OsNTL3 (ntl3‐1 and ntl3‐2) mutant seedlings grown at 29 ºC were transferred to 45 ºC for 5 days and then photographed after recovering at 29 ºC for 7 days (d). Survival rate was count based on the appearance of newly developed green leaves (e). Totally, 141 rice plants under each temperature condition for each genotypes were examined for phenotype analysis. Protein domain structures of OsNTL3 in plants were depicted in c. (f–g) ROS accumulation and electrolytic leakage in WT and OsNTL3 mutant plants under different temperature conditions. Four‐week‐old wild‐type (WT) seedlings and OsNTL3 gene‐edited mutant seedlings grown at 29 ºC were transferred to 45 ºC for 16 hr, leaves were sampled for DAB staining (f) or transferred to 45 ºC for 5 hr, and leaves were sampled for electrolyte conductivity measurements (g). Error bars represent SE (n = 6 in e and n = 3 in g). Different letters indicate significant differences in comparisons between two samples as determined by LSD test following ANOVA analysis (P < 0.05). Bar = 1 cm.
