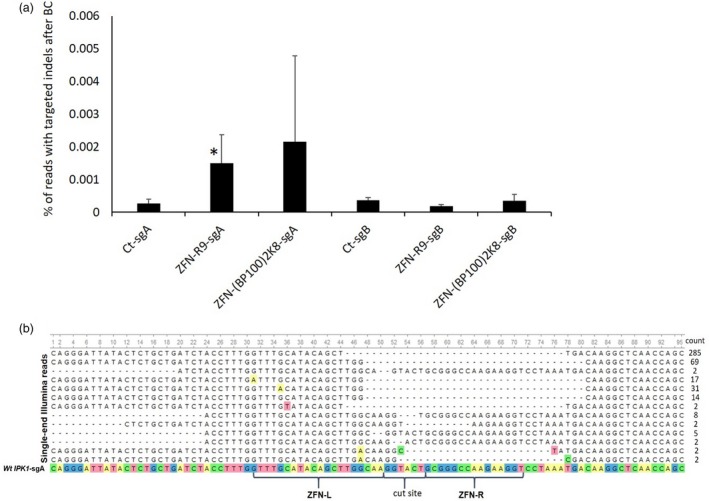
Figure 3.

Analysis of ZFN‐IPK1 activity at the target site following transfection of wheat microspores with ZFN‐CPP complexes. a – the bar graphs represent the percentage of reads with targeted indels after background correction (BC) at either subgenome A or B (sgA and sgB, respectively) analysed using NGS. Treatments were done with 1 µg of ZFN‐IPK1 protein (total for both monomers) that was combined with 1 µg of either of the CPPs, bar marked with asterisk indicates statistically significant difference as compared to corresponding control (Student’s t‐test, P < 0.1); b – representative indels at the subgenome A target site for both CPPs used. Multiple sequence alignment of the processed reads was done using MAFFT aligner tool in Unipro UGENE program (Okonechnikov et al., 2012). Ct – no transfection control. All treatments were done in two biological replicates.
