
Figure 5.
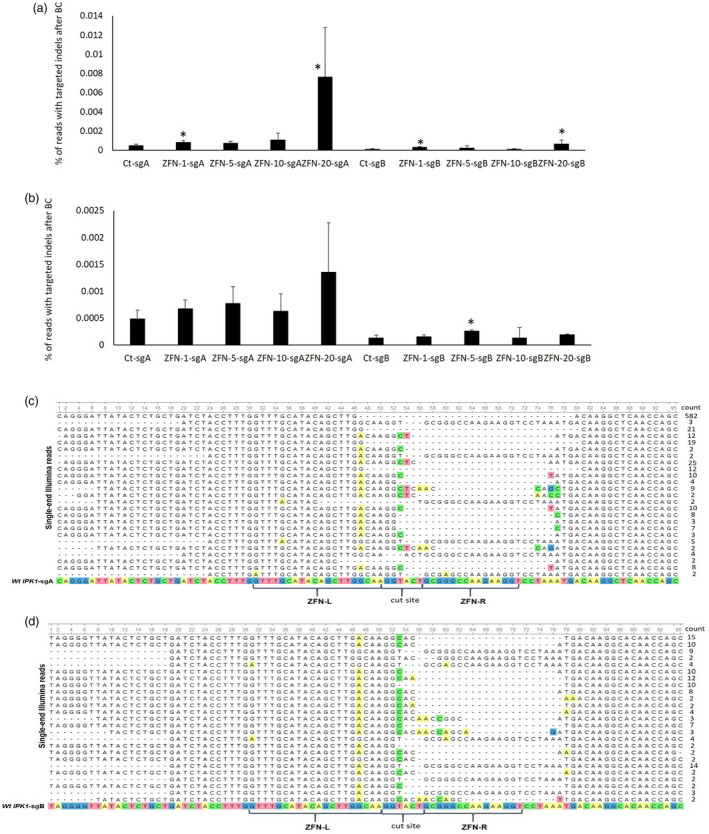
Cleavage activity of ZFN‐IPK1 protein at either subgenome A (sgA) or B (sgB) following transfection of wheat haploid ELS (3 weeks old) with different CPP‐ZFN complexes. A and B – the bar graphs represent the percentage of reads with targeted indels after background correction (BC) at subgenomes A and B as analysed using NGS for either cys(Npys)‐(D‐R)9 (A) or cys(Npys)‐(BP100)2K8 (B) CPP, respectively. Ct – no transfection control, ZFN‐1, ZFN‐5, ZFN‐10 and ZFN20 – ELS transfected with either 1, 5, 10 or 20 µg of ZFN‐IPK1 (total amount for both monomers) protein combined with the corresponding weight of either cys(Npys)‐(D‐R)9 or cys(Npys)‐(BP100)2K8. Experiment was done in 2 biological and 3 technical reps, the bars marked with asterisks indicate statistically significant difference as compared to corresponding controls (Student’s t‐test, P < 0.1). C and D ‐ representative types of edits detected using NGS at either subgenome A or B for both CPPs, respectively. Multiple sequence alignment of the processed reads was done using MAFFT aligner tool in Unipro UGENE program (Okonechnikov et al., 2012).