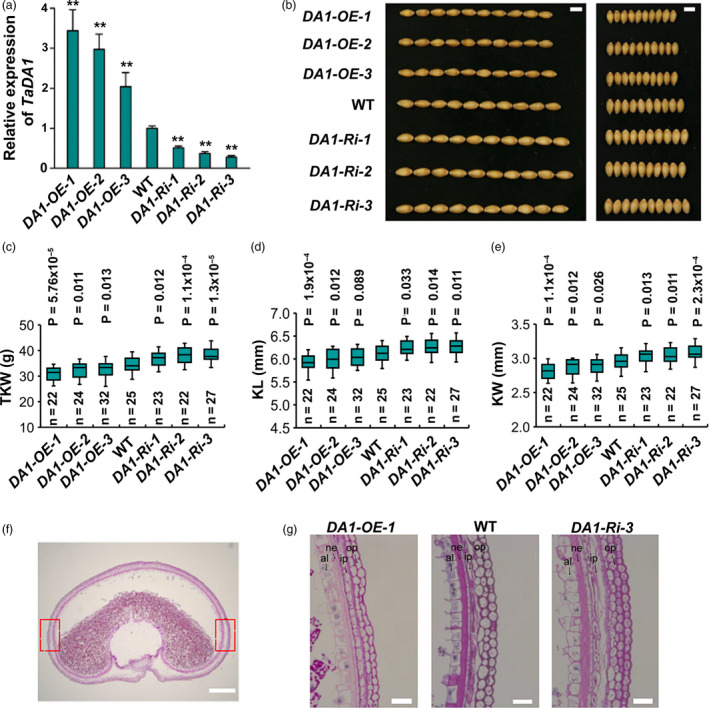
Figure 2.

Phenotypic comparison of kernel traits among TaDA1 overexpression lines, RNAi lines, and the WT under field conditions. (a) Expression levels of TaDA1 in three representative T2 generation overexpression lines (OE‐1–3), RNAi lines (Ri‐1–3), and the WT. The values are presented as mean ± SD. **P < 0.01 (ANOVA) indicates a significant difference to the WT. (b) Comparison of the kernel phenotypes among these genotypes. Bar = 5 mm. (c) Thousand‐kernel weights (TKW), (d) kernel lengths (KL), and (e) kernel widths (KW) of these genotypes. Box plots showing the components of descriptive statistics including sample size (n), medians (black lines), upper and lower quartiles (box edges), minimums and maximums (whiskers), and P values (ANOVA). (f) A representative section of the middle portion of a developing grain of Fielder (WT) wheat at 15 DPA. Bar = 500 µm. (g) Comparison of the outer pericarp cells in the TaDA1 overexpression line (DA1‐OE‐1), RNAi line (DA1‐Ri‐3), and WT. Each image was taken at the boxed areas indicated in (f). Op, outer pericarp; ip, inner pericarp; ne, nucellar epidermis; al, aleurone layer. Bars = 50 µm.
