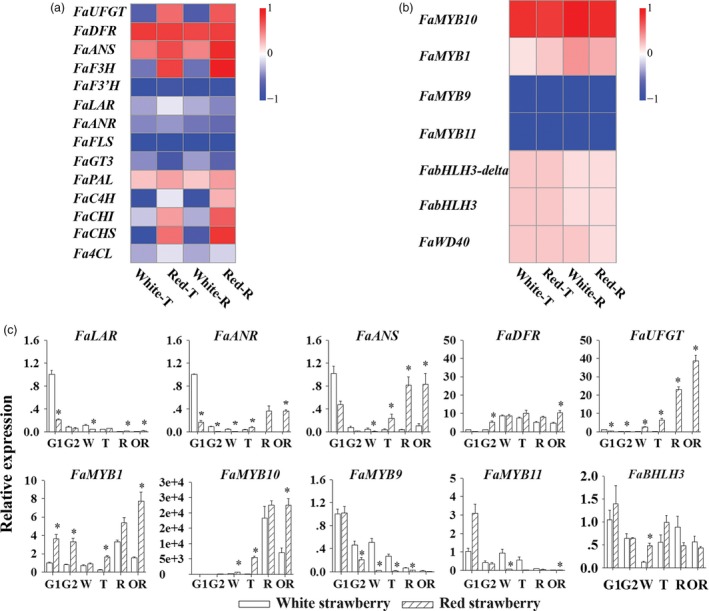
Figure 3.

Expression analyses of key genes of flavonoid biosynthesis. (a) RNA‐seq heatmap analysis for transcript levels of structural genes in the white and red strawberry varieties. (b) RNA‐seq heatmap analysis for transcript levels of regulatory genes in the white and red strawberry varieties. (c) The real‐time PCR results for transcript levels of structural genes and regulatory genes in the white and red strawberry varieties. Asterisks (*) represent that the values of the corresponding transcription levels (n = 3, ±SE) are significantly different at p < 0.05 as determined using independent t‐test.
