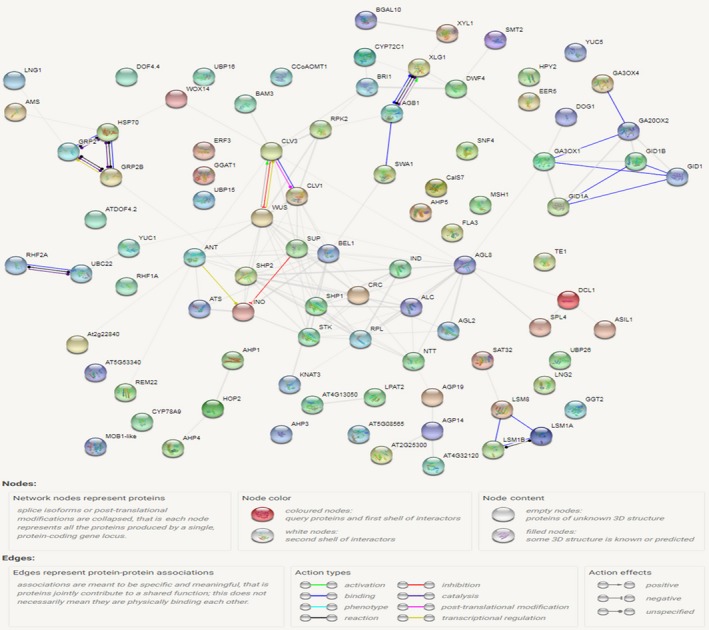
Figure 5.

Genetic regulatory network constructed for fruit size genes. The figure shows different action types and effects, which are represented by different colours of lines and arrows between different genes/proteins. For example, the blue colour lines/arrows show binding; green colours represent activation whilst red colours show inhibition, black colours represent reaction between different genes, and so on. The different types of arrows show the positive, negative and unspecified effects of genes.
