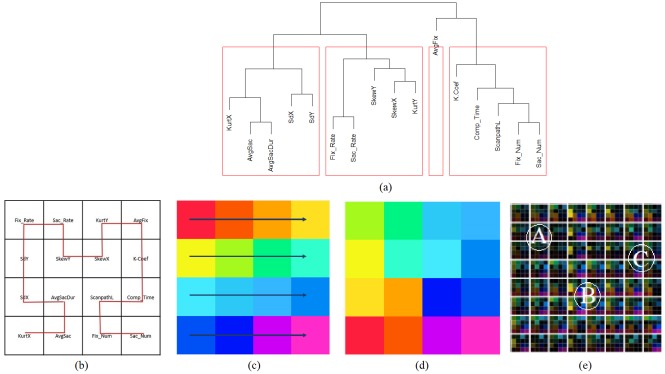
Figure 6.
Overview of the procedure followed in the generation of Dimensionally Stacked Similarity Matrix (DSSM). The dendrogram shown in Figure (a) reveals the proximity between metrics from eye-tracking data. Figure (b) shows the order in which metrics are stacked in the similarity matrix following a second-order Hilbert curve. Figure (c) shows the 16 colors with varying hue to represent each similarity value in the sub-grid. Figure (d) shows that choosingthe Hilbert curve preserves locality in colors. Figure (e)displays an example of multi-dimensional stacked metrics with dimension 8 ✕ 8 for 8 participants.

