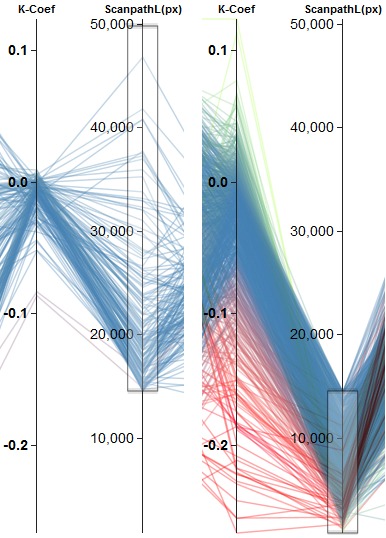
Figure 10.

Combining completion time and scanpath length to generate a new 1D metric (W-Avg). (a) shows that values above a threshold of 0.3 of W-Avg result in one group of participants that exhibit ambiguous gaze behavior, whereas (b) depicts the second group having a more ambient gaze behavior, according to the Ҡ coefficient.
