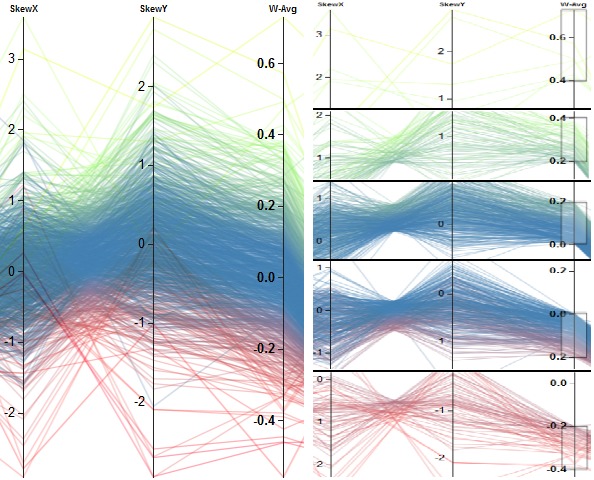
Figure 11.

The color-encoded results are shown in (a). Clustering was performed on the weighted average of the first two columns. Overall, a negative correlation can be recognized. Selecting different values ranges of the weighted average leads to the selection of subgroups of similar skewness values. The weights were set to 0.5 for the two metrics. All subgroups exhibit also a negative correlation. This is shown in (b).
