Figure 13.

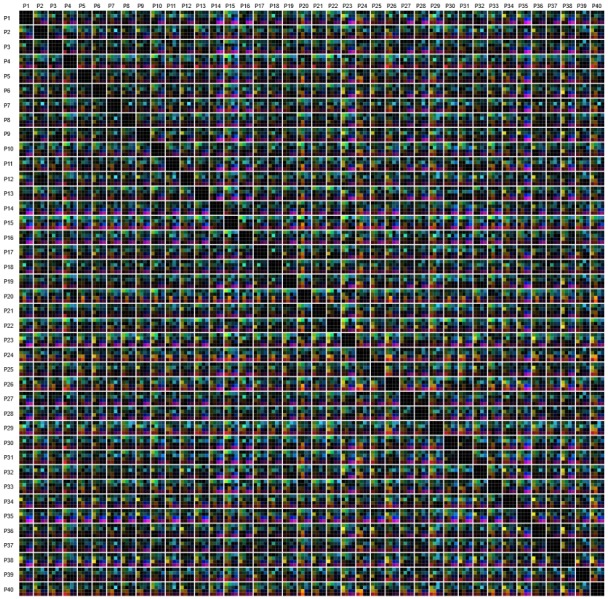
Similarity matrices including all participants. All 16 similarity metrics are depicted by color-encoded. The order of the participants is increasing from left to right and top to bottom, according to the participant ID.

Similarity matrices including all participants. All 16 similarity metrics are depicted by color-encoded. The order of the participants is increasing from left to right and top to bottom, according to the participant ID.