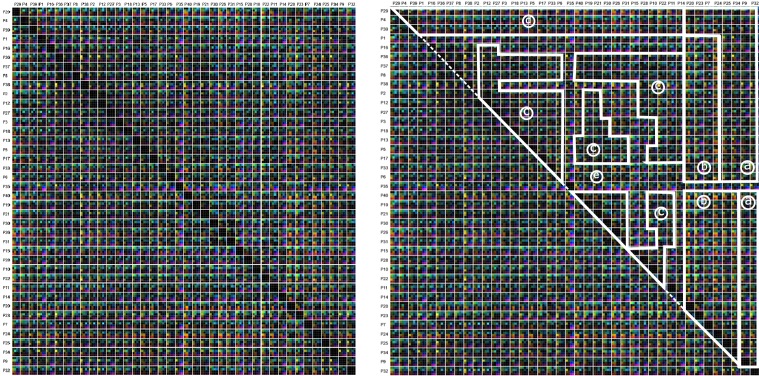
Figure 14.
Similarity matrices including all participants. All 16 similarity metrics are depicted by color. The order of the participants was changed according the result of the clustering based on the new combined metric (skewness in x- and y- direction with a weight of 0.3; kurtosis in x- and y- direction with a weight of 0.7). By visual inspection, six clusters emerge ((a)-(e)), highlighted by white lines.

