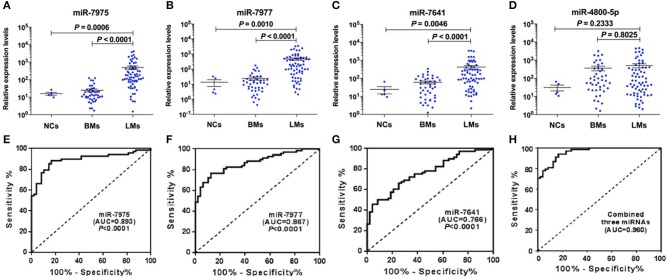
Figure 2.
Validation of candidate CSF miRNAs and evaluation of their diagnostic performance in validation cohort. RELs of CSF miR-7975 (A), miR-7977 (B), miR-7641 (C), and miR-4800-5p (D) in 68 LM patients vs. 48 non-LM controls (BMs, n = 43; NCs, n = 5) were detected by qRT-PCR. Then ROC curve analysis with RELs of CSF miRNAs including miR-7975 (E), miR-7977 (F), miR-7641 (G), and the combined three CSF miRNAs (H), was performed for discrimination of LMs and non-LM controls. RELs of miRNAs (y-axis) are normalized to cel-miR-39. The black horizontal lines represent median REL values with SEM. A value of P < 0.05 was regarded as statistically significant. RELs, relative expression levels; LMs, leptomeningeal metastases; BMs, brain metastases; NCs, non-cancers; SEM, standard error of mean; AUC, area under curve.

