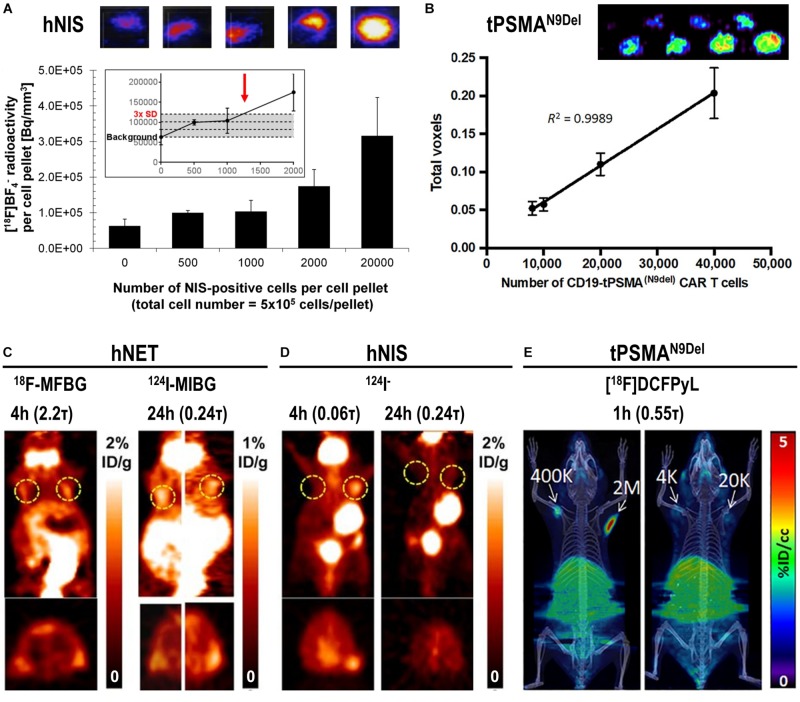
FIGURE 5.
In vitro and in vivo detection sensitivity of reporter gene expressing cells. (A) In vitro determination of the detection limit of NIS-positive cells within a cell pellet of NIS-negative cells for the NIS radio tracer [18F]BF4– using nanoPET/CT equipment from Mediso. For experimental details see Diocou et al. (2017) (top) Typical results of nanoPET/CT imaging of cell pellets and (bottom) quantitative analysis of imaging experiments. The limit of detection was determined to be ∼1,250 NIS-positive cells (inset, red arrow). (B) Standard curve demonstrating a linear relationship between the PET signal and the number of CD19-tPSMAN9del CAR-T. (top) In vitro phantom from which the standard curve was derived. The in vitro phantom used varying numbers of CD19-tPSMA(N9del) CAR T cells incubated with [18F]DCFPyL, a high affinity, positron-emitting ligand targeting PSMA; cell numbers were in the top row 103, 2⋅103, 4⋅103, and 6⋅103, and in the bottom row 8⋅103, 104, 2⋅104, and 4⋅104. Images were acquired using a SuperArgus small-animal PET/CT instrument from Sedecal. The data in the graph show results from the bottom row of images. The detection limit was determined to be around 2,000 cells. For experimental details see Minn et al. (2019). (C,D) PET in vivo imaging of human primary T-cells transduced with hNET (C) or hNIS (D) reporter genes. Different numbers of T-cells were injected subcutaneously, followed by systemic administration of indicated corresponding radiopharmaceuticals. PET imaging at indicated time points after radiotracer administration was performed using a Focus 120 microPET scanner from Siemens. Number of T-cells injected is (left dashed ring) 3⋅105 and (right dashed ring) 106. No potentially interfering signals were thresholded and data are expressed as percentage injected dose per gram (%ID/g). For experimental details see Moroz et al. (2015). (E) NSG mice injected with the indicated number of CD19-tPSMAN9del CAR-T in 50 μL (50% Matrigel) in the shoulders (white arrows). Mice were in vivo imaged on the Sedecal’s SuperArgus small-animal PET/CT at 1 h after administration of the corresponding radiotracer [18F]DCFPyL. PET data are expressed in percentage of injected dose per cubic centimeter of tissue imaged (%ID/cc). To improve the display contrast of the in vivo images, relatively high renal radiotracer uptake was masked using a thresholding method. For experimental details see Minn et al. (2019). (Figure combined from the publications referenced in the legend above; permissions from corresponding publishers obtained).

