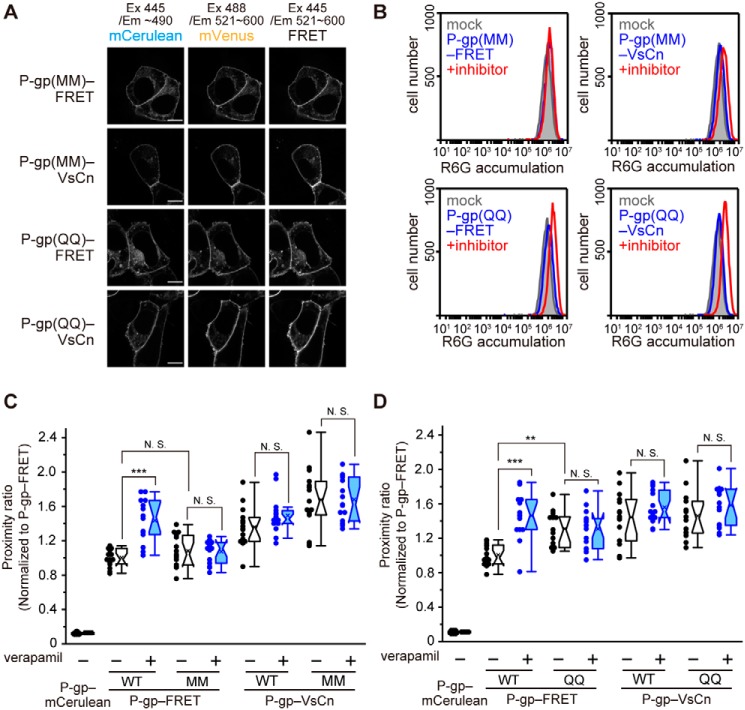
Figure 4.
Proximity ratio of ATP-binding–deficient and ATP hydrolysis-deficient mutants. A, fluorescent images of the mutants. Scale bars, 10 μm. B, substrate transport activity of the mutants. The proximity ratio in intact cells transiently transfected with the ATP-binding–deficient mutant MM (C) and ATP hydrolysis-deficient mutant QQ (D). Cells were treated with 100 μm verapamil (blue) or DMSO (empty) for 5 min at 37 °C. The proximity ratio is shown to that of P-gp–FRET without verapamil. n = 12–15 cells per sample; **, p < 0.01; ***, p < 0.001; N.S., p > 0.05.

