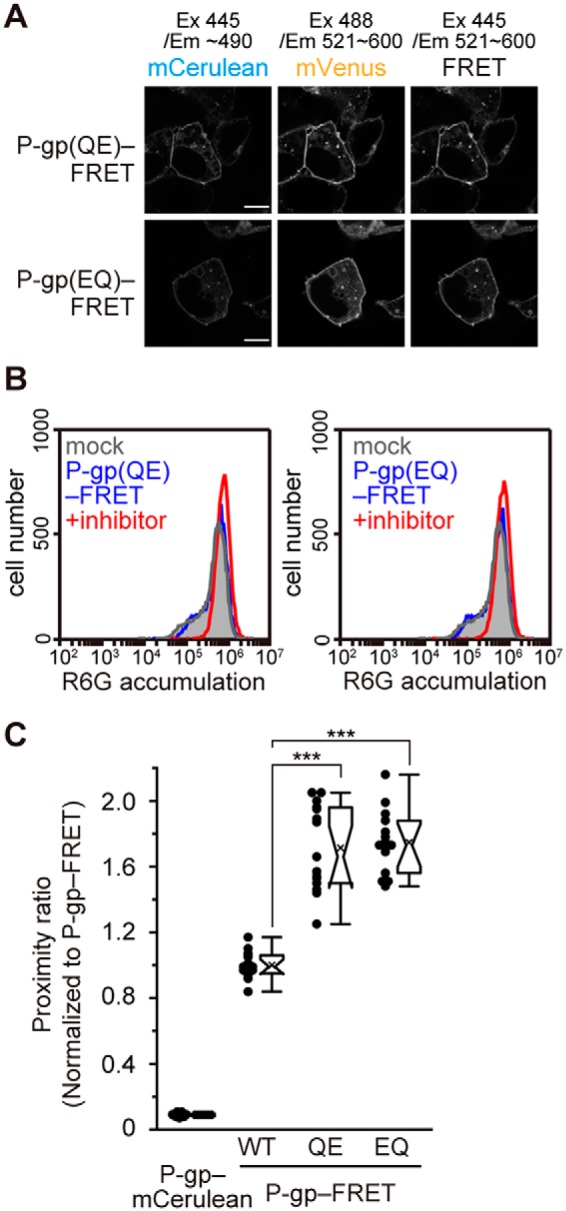
Figure 7.

Proximity ratio of single Walker B mutants. A, fluorescent images of P-gp(QE)–FRET and P-gp(EQ)–FRET obtained using an LSM700 confocal microscope. Scale bars, 10 μm. B, substrate transport activity of the single Walker B mutants. C, proximity ratio in intact cells of the single Walker B mutants, shown relative to that of P-gp–FRET. n = 15 cells per sample; ***, p < 0.001.
