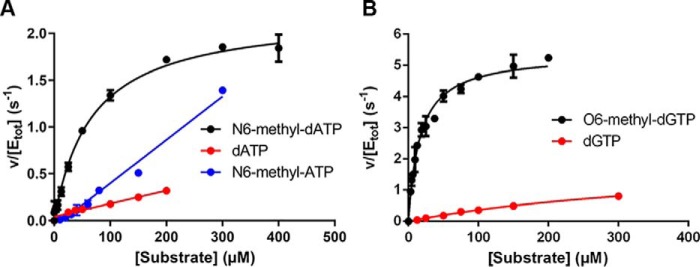
Figure 3.
Kinetic characterization of MTH1-catalyzed hydrolysis of dATP, N6-methyl-dATP, N6-methyl-ATP, dGTP, and O6-methyl-dGTP. A, substrate saturation curves of MTH1 (1 nm) were produced using MTH1 reaction buffer (pH 7.5). Initial rates were determined at dATP concentrations varied between 0 and 200 μm and between 0 and 300 μm for N6-methyl-dATP and N6-methyl-ATP, respectively, and for dGTP and O6-methyl-dGTP (B) using 0–300 and 0–200 μm, respectively. Formed PPi was detected using PPiLightTM Inorganic Pyrophosphate Assay (Lonza) and the assay signal was converted to concentration of PPi by including a PPi standard curve on the assay plate.

