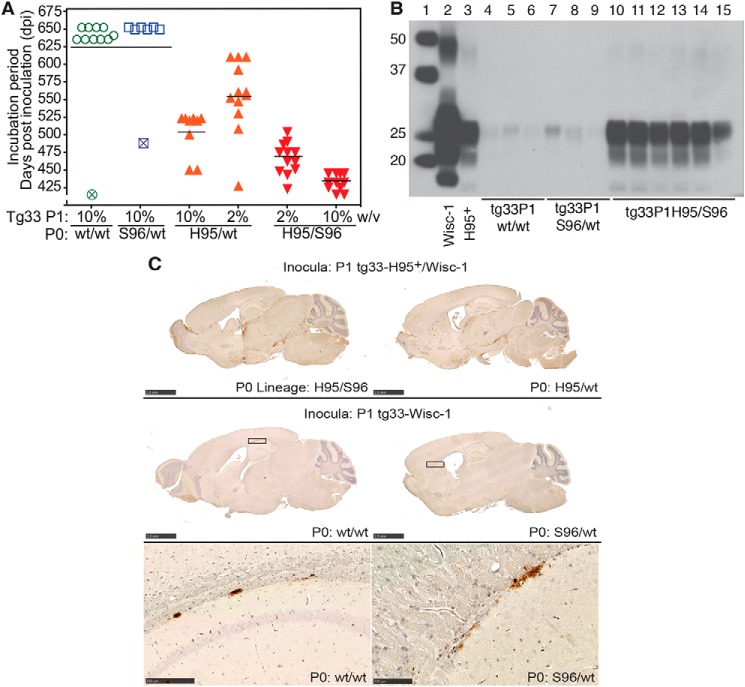
Figure 11.
Re-isolation of H95+ in tg60 mice inoculated with tg33 prions from different deer CWD lineages (P0). A, selection of H95+ conformers in tg60 mice. Tg33 brain homogenates from individual mice of each primary transmission (P1) were inoculated into tg60 mice. Open symbols represent tg60 mice euthanized with no disease signs. Crossed symbols represent mice euthanized due to intercurrent disease. B, Western blotting of PK-res PrPCWD in tg60 mice after exposure to tg33 mice prions. Lane 1, molecular weight marker. Lane 2, Wisc-1 from tg33 mice. Lane 3, H95+ from tg60 mice. Lanes 4–6, asymptomatic tg60 mice exposed to tg33-WT/WT prions, Wisc-1 strain. Lanes 7–9, asymptomatic tg60 mice exposed to tg33-Ser-96/WT prions, Wisc-1 strain. Lanes 10–12, tg60 mice exposed to tg33–His-95/WT prions. Lanes 13–15, tg60 mice exposed to tg33–His-95/Ser-96 prions, H95+/Wisc-1 strains mixture. C, PrPCWD deposition pattern of H95+ strain in tg60 mice exposed to P1 tg33 brain prions consisting of co-propagated Wisc-1 and H95+ strains (upper panel). Distribution of PrPCWD aggregates in tg60 mice exposed to prions from P1-tg33 mice that replicated the Wisc-1 strain (middle and bottom panels). PrPCWD aggregates in between the corpus callosum and the hippocampus and in between the corpus callosum and the caudate putamen from in tg60 mice exposed to Wisc-1 from the WT/WT or Ser-96/WT lineages (squares in middle panel). All tissues were stained with BAR224 mAb. Bars (upper and middle panels), 2.5 mm. Bar (bottom left panel), 250 μm. Bar (bottom right panel), 100 μm. Western blotting and histological analyses were performed in 3–6 mice per passage line.

