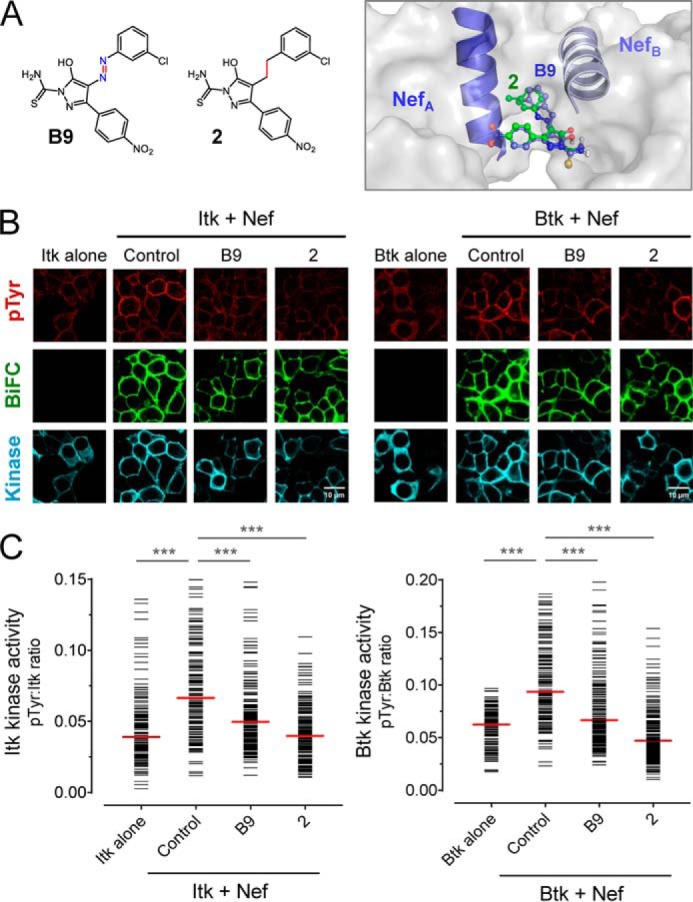
Figure 7.

Small molecule Nef inhibitors block Nef-mediated Itk and Btk activation. A, structures of small molecule Nef inhibitors, B9 and compound 2, are shown on the left. Computational docking predicts interaction of both inhibitors with the Nef dimerization interface (model at right; Nef αB helices that form this interface are also shown). B and C, Itk and Btk were expressed in 293T cells either alone or together with WT Nef as BiFC pairs in the absence (Control) or presence of B9 or compound 2 (final concentration of 1.0 μm). Following inhibitor treatment, the cells were fixed and stained for confocal microscopy with anti-pTyr antibodies as a measure of kinase activity (red) and anti-V5 antibodies to verify kinase protein expression (blue). Nef interaction with each kinase was visualized as fluorescence complementation of the YFP variant, Venus (BiFC; green). B, representative images from each experiment. C, single-cell image analysis. Mean fluorescence intensities for the pTyr and Itk or Btk signals were determined for ≥100 cells from each condition using ImageJ. The fluorescence intensity ratio (pTyr:Itk expression) for each cell is shown as a horizontal bar, with the median value indicated by the red bar. Student's t tests were performed on the groups indicated by horizontal lines above the plot; p < 0.0001 in each case (***).
