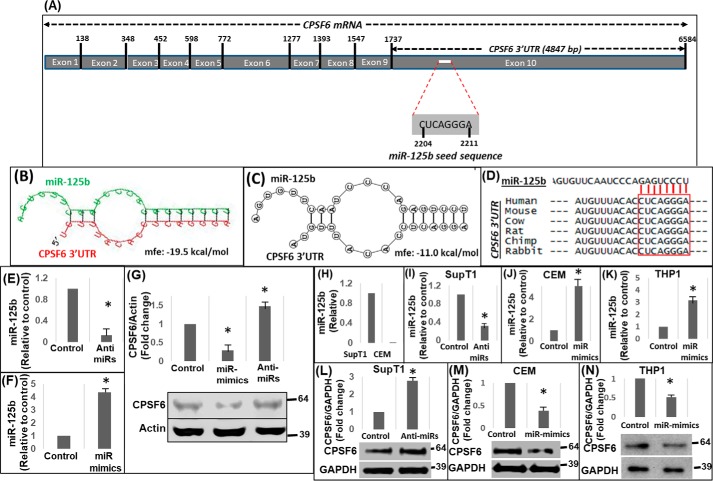
Figure 1.
miR-125b negatively regulates CPSF6 expression. A, schematic representation of CPSF6 mRNA (∼6.6 kb) containing the miR-125b seed sequence in the 3′UTR (∼4.8 kb). Results from in silico analysis of CPSF6 3′UTR sequences for the presence of miR-125–binding sites and the formation of hairpin structures between the miR and the 3′UTR by using (B) RNAHybrid 2.1.2 and (C) RNAstructure-biFold prediction web servers. Mfe, minimum free energy of the predicted secondary structures. D, sequence alignment of 3′UTR of CPSF6 mRNA from different mammalian species. E and F, qPCR analyses of miR-125b levels in HEK-293 T cells treated with anti-miRs (E) or miR-mimics (F) of miR-125b or scrambled controls (F). G, representative immunoblot showing CPSF6 protein expression in miR-125b–knockdown and over-expressing cells. The graph above the immunoblot shows densitometry analysis of immunoblots from three independent experiments. H, endogenous levels of miR-125b in SupT1 and CEM cells as measured by qPCR. Results from qPCR analysis of knockdown of miR-125b levels in SupT1 cells (I) and over-expression of miR-125b via miR-mimics in CEM (J) and THP1 (K) cells. Representative immunoblots showing CPSF6 and GAPDH (loading control) protein expression in miR-125b–knockdown SupT1 cells (L), miR-125b over-expressing CEM cells (M), and miR-125b over-expressing THP1 cells (N). The graphs above the blots show densitometry analysis of immunoblots from three independent experiments. Error bars represent S.E. * represents p < 0.05 for the comparison of anti-miR and miR-mimics versus scrambled controls.

