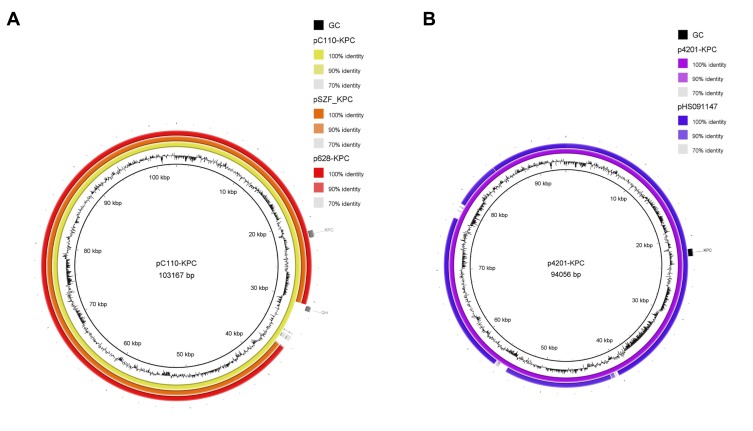
Figure 2.
The circular maps of pC110-KPC and p4201-KPC. (A). The circle in yellow represented plasmid pC110-KPC, in orange represented pSZF_KPC, in red represented p628-KPC. (B). The circle in purple represented p4201-KPC, in blue represented pHS091157. The peak map in (A) and (B) represented the GC content of plasmid pC110-KPC and p4201-KPC respectively. Arcs in grey indicate the position of blaKPC and blaqnr in plasmids pC110-KPC and p4201-KPC. The maps were created by Brig v0.95.

