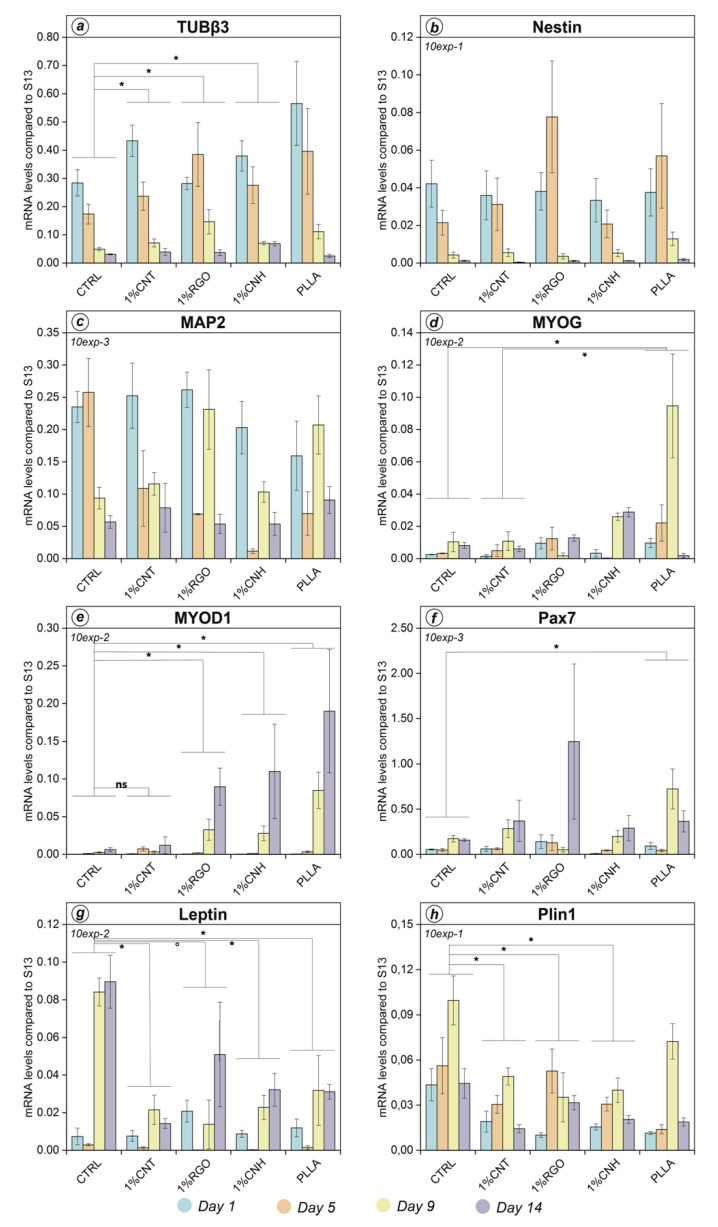
Figure 3.
Marker-gene expression during 14 day treatment. Profiled genes in panels a to h are indicated in the upper horizontal bar of each panel. CTRL: differentiative medium w/o scaffold; 1%CNT: 1 wt% CNT@PLLA; 1%RGO: 1 wt% RGO@PLLA; 1%CNH: 1 wt% CNH@PLLA; PLLA: bare PLLA. Control samples were grown in same medium but without scaffolds. Data represent mean ± SEM of three independent experiments performed in duplicate. ° Significance at p < 0.1 among indicated samples; * significance at p < 0.05 among indicated samples.

