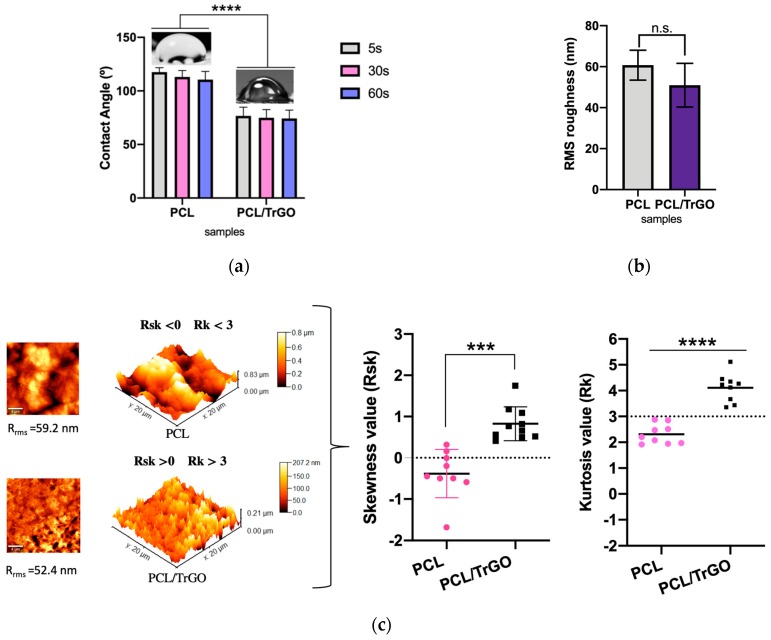
Figure 6.
(a) Contact angle measurement for PCL and PCL/TrGO scaffolds. **** denotes a significant difference with a value p < 0.0001 between the samples indicated (n = 5 independent tests performed for each time spent); (b) RMS roughness values of PCL an PCL/TrGO scaffolds, n.s. denotes nonsignificant difference between the samples (n = 5 different zones of measurements); (c) AFM micrograph of surface roughness and topography of PCL scaffolds and PCL/TrGO scaffolds (n = 5 independent measurements) (left), graphs of skewness (Rsk) and kurtosis (Rk) values of PCL and PCL/TrGO samples (right). *** and **** denote a significant difference with a value p < 0.001 and p < 0.0001, respectively, between the samples indicated.

