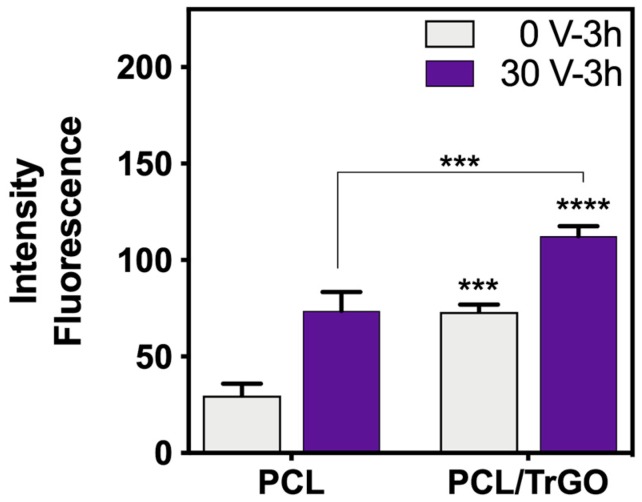
Figure 8.
Metabolic activity graph of hBM-SCs obtained from the resazurin assay without ES (0 V) in gray and ES (30 V) in purple with 3 h of ES. *** and **** denote a significant difference with a value p < 0.001 and p < 0.0001, respectively, between the samples indicated, and a value p < 0.001 denotes the control sample PCL 0 V. n = 3 independent experiments were performed in triplicate per plate at three days from seeding cells in/on the scaffolds.

