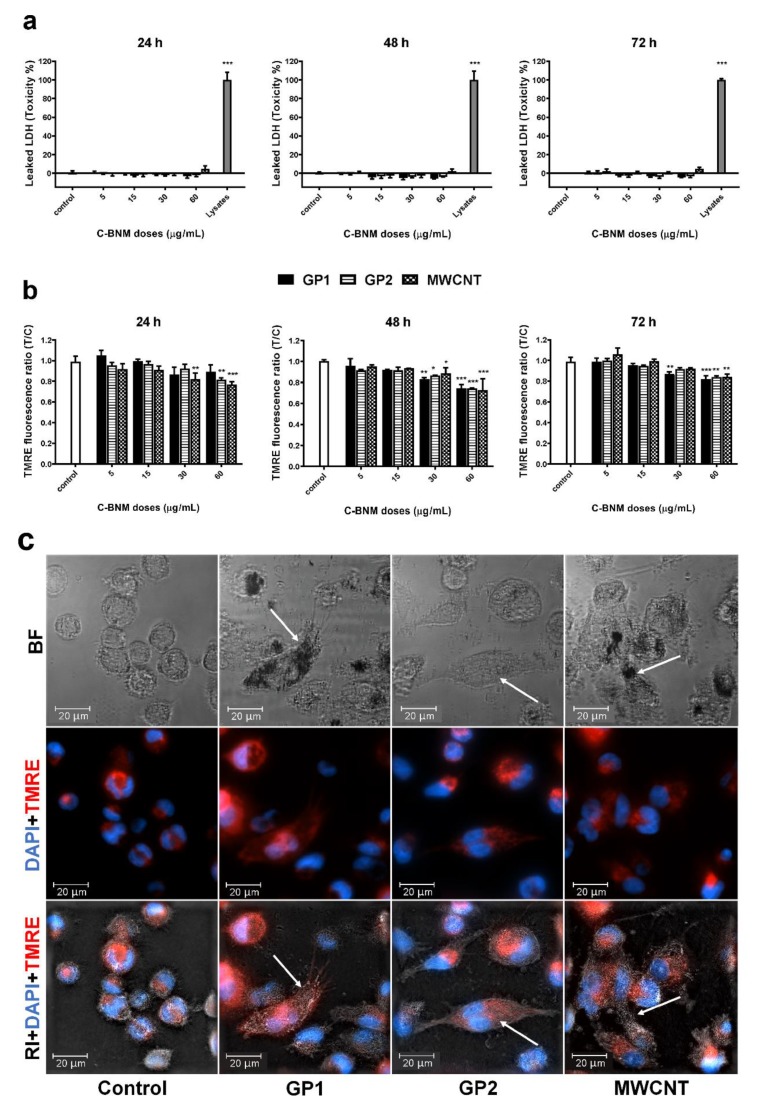
Figure 5.
Cell responses to C-BNM: (a) Percentage of cytotoxicity via LDH assay after 24 h, 48 h and 72 h exposure. Data are reported as average ± standard error of the mean (Toxicity % = (T – C)/(L – C) × 100); T—test cells; C—untreated control; L—lysates. The symbol *** p < 0.001 highlights statistical significance as compared to the corresponding C; (b) mitochondrial potential via TMRE staining after 24 h, 48 h and 72 h exposure. Data normalised to control (untreated cells) represent an average ± standard error of the mean. The symbols * p < 0.05; ** p < 0.01; *** p < 0.001 highlight the statistical significance as compared to the corresponding control; (c) representative images of THP-1 cells loaded with C-BNM (white arrows), after 24 h exposure, with labelled active mitochondria (TMRE) and nuclei (DAPI) detected using a holotomographical microscopy; RI—refractive index; BF—bright field.

