Figure 2.
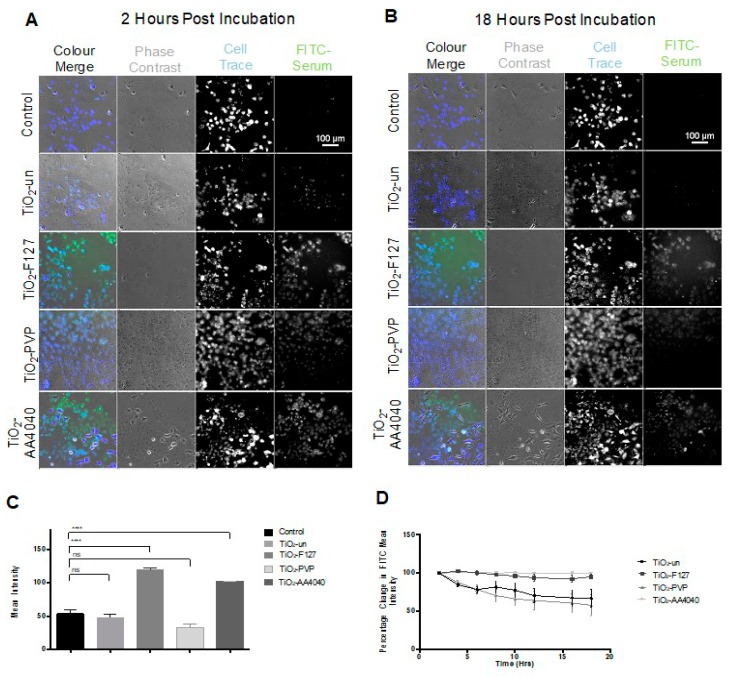
Biostation CT-acquired images and data showing the FITC-labeled serum intensity in A549 cells observed between 2 and 18 h post-exposure to FITC-labeled serum-containing medium in the absence of NMs (control) or with uncoated (TiO2-un), F127 (TiO2-F127), PVP (TiO2-PVP), or AA4040 Dispex-coated (TiO2-AA4040) TiO2 NMs. (A) At 2 h post-incubation, a significant green signal is retained versus controls treated with FITC-serum in the absence of NMs; (B) at 18 h post-incubation, there is a significant loss of the FITC signal in TiO2-un- and TiO2-PVP-treated samples, while TiO2-F127 and TiO2-Dispex treatments exhibit a much smaller change. (C) The total raw mean FITC intensity data averaged over time showed statistically significant differences in intensity between the control, TiO2-F127, and TiO2-AA4040 NMs when treatment groups were compared to control with an unpaired t-test (p < 0.001). Significance was not observed when controls were compared to cells treated with TiO2-un and TiO2-PVP NMs. (D) Normalizing mean intensity data to a percentage change in signal between subsequent time points shows no significant change in the FITC-serum intensity in TiO2-AA4040- and TiO2-F127-treated cells, suggesting the retention of an FITC-labeled serum corona. Comparatively, TiO2-un- and TiO2-PVP-coated NMs show a progressive loss of FITC signal over the time observed. Log transformation of the percentage change allows for analysis of the data set with a repeated measures ANOVA test indicating significance (p = 0.0250) in variance across NMs, and significance (p = 0.018) in variance across time (two-way ANOVA, SEM, n = 3).

