
Figure 1. Active regulatory elements in T lymphocytes of NOD mice are associated with type 1 diabetes.
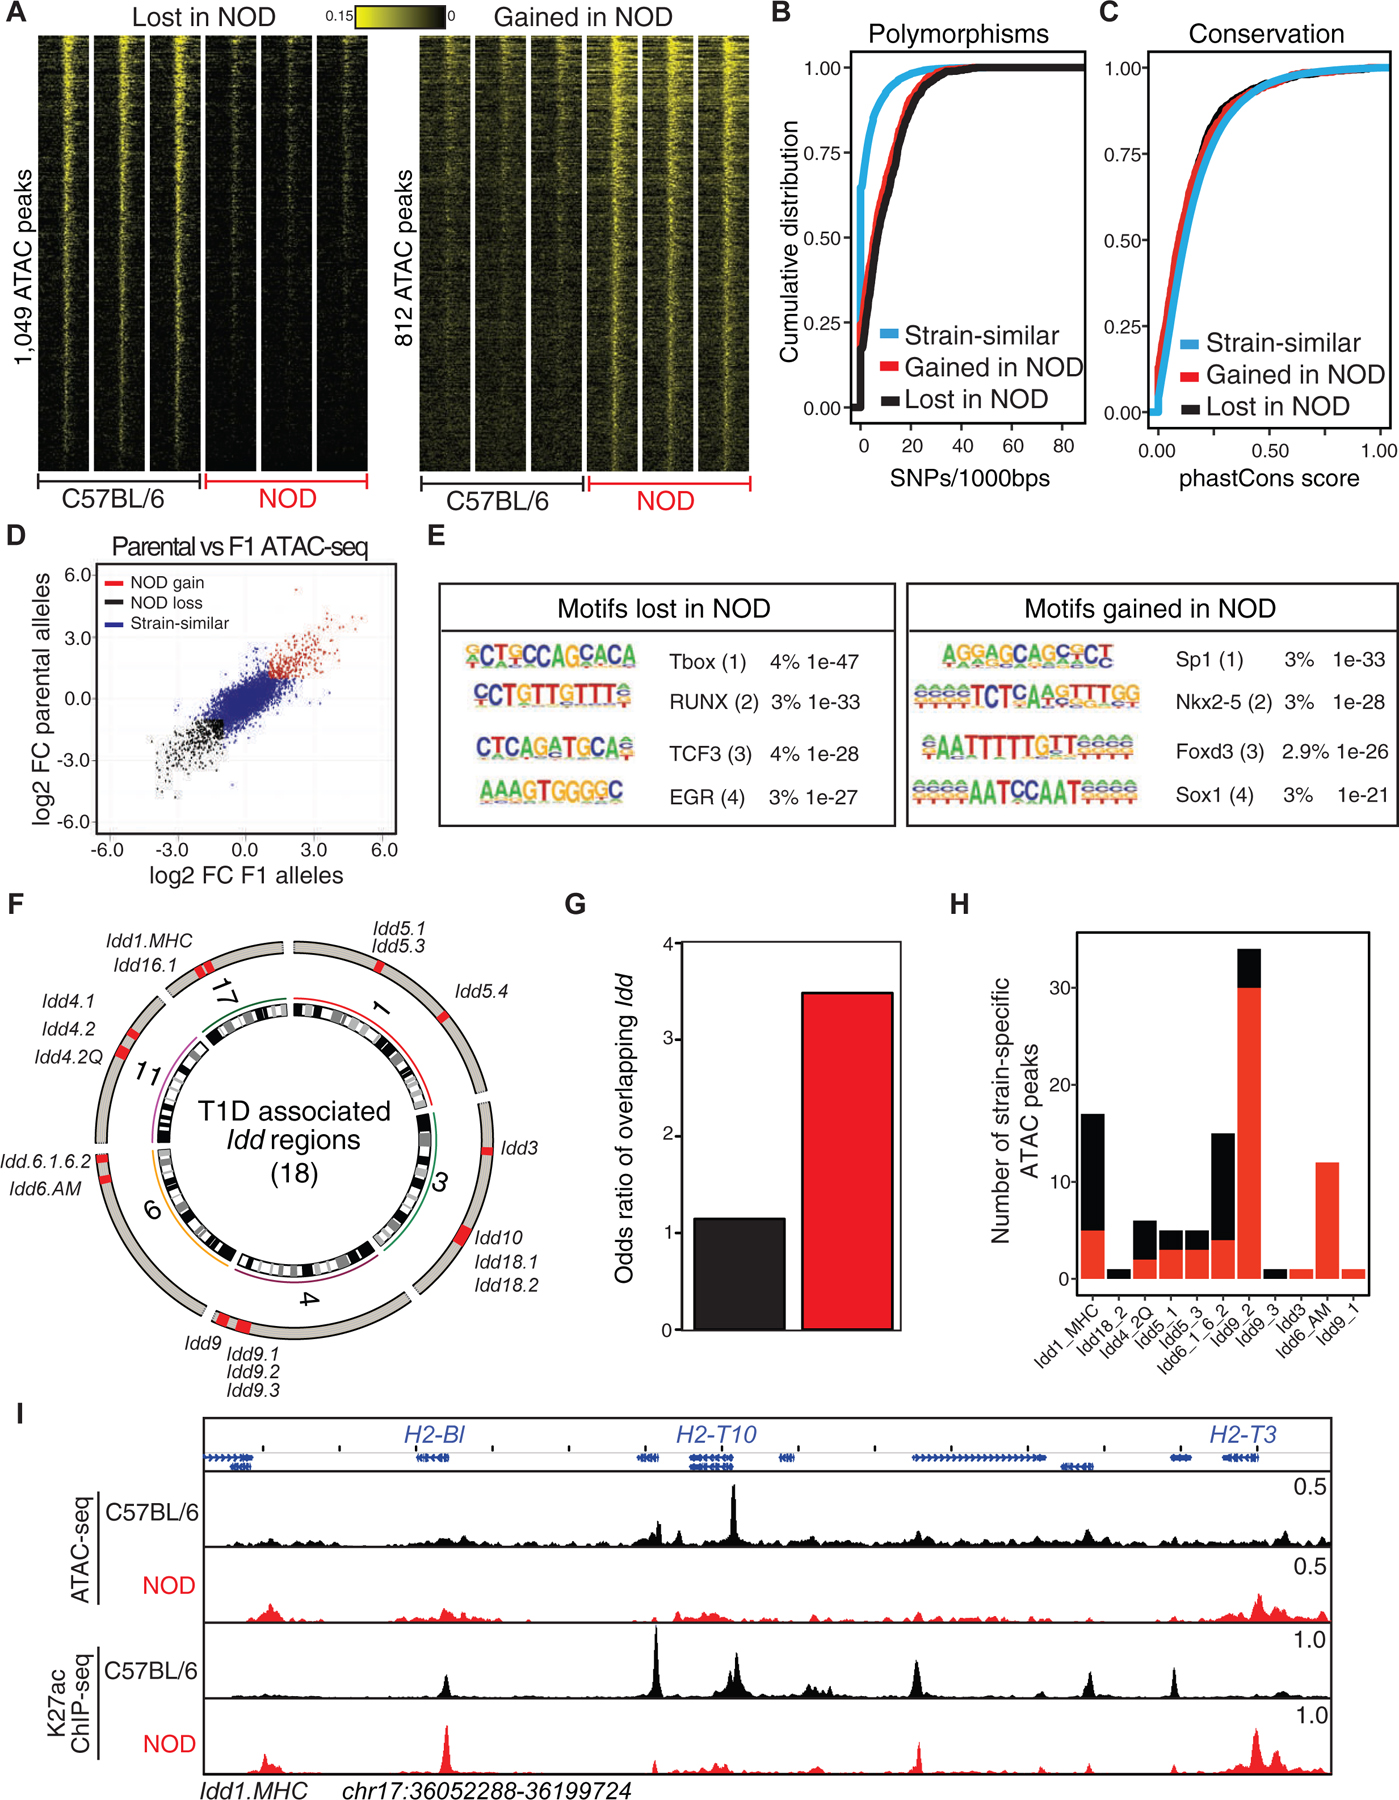
(A) Heatmaps display strain-specific chromatin accessibility measured by ATAC-seq in double-positive thymocytes of 4-week old male C57BL/6 and NOD mice. Three technical and two biological replicates were generated for each strain.
(B-C) Cumulative distribution function for number of SNPs between C57BL/6 and NOD per 1000 base-pair (B) and sequence conservation (C) at strain-similar regions in addition to those gained or lost in NOD.
(D) Ratio-ratio plot of ATAC-seq parental log2 fold change in double-positive thymocytes derived from C57BL/6 and NOD mice versus allele-specific log2 fold change in double-positive thymocytes derived from C57BL/6 × NOD F1 mice.
(E) De novo motif analysis of strain-specific ATAC-seq peaks with peaks from the opposite strain as control. Boxes display percent enrichment, log10 p-values for enrichment of the motif, and its rank order in parentheses.
(F) 18 insulin-dependent diabetes (Idd) intervals are distributed across 6 chromosomes.
(G) A higher odds ratio is associated for Idd regions overlapping with regulatory elements that gained chromatin accessibility in NOD mice compared with those elements that lost accessibility in this strain.
(H) Barplot demonstrates the number of strain-specific peaks within each Idd interval.
(I) ATAC-seq and H3K27ac ChIP-seq profiles at Idd1.MHC interval. All bigwig files are tag-per-million normalized.