
Figure 2. Increased expression of genes in T lymphocytes of NOD mice are associated with type 1 diabetes.
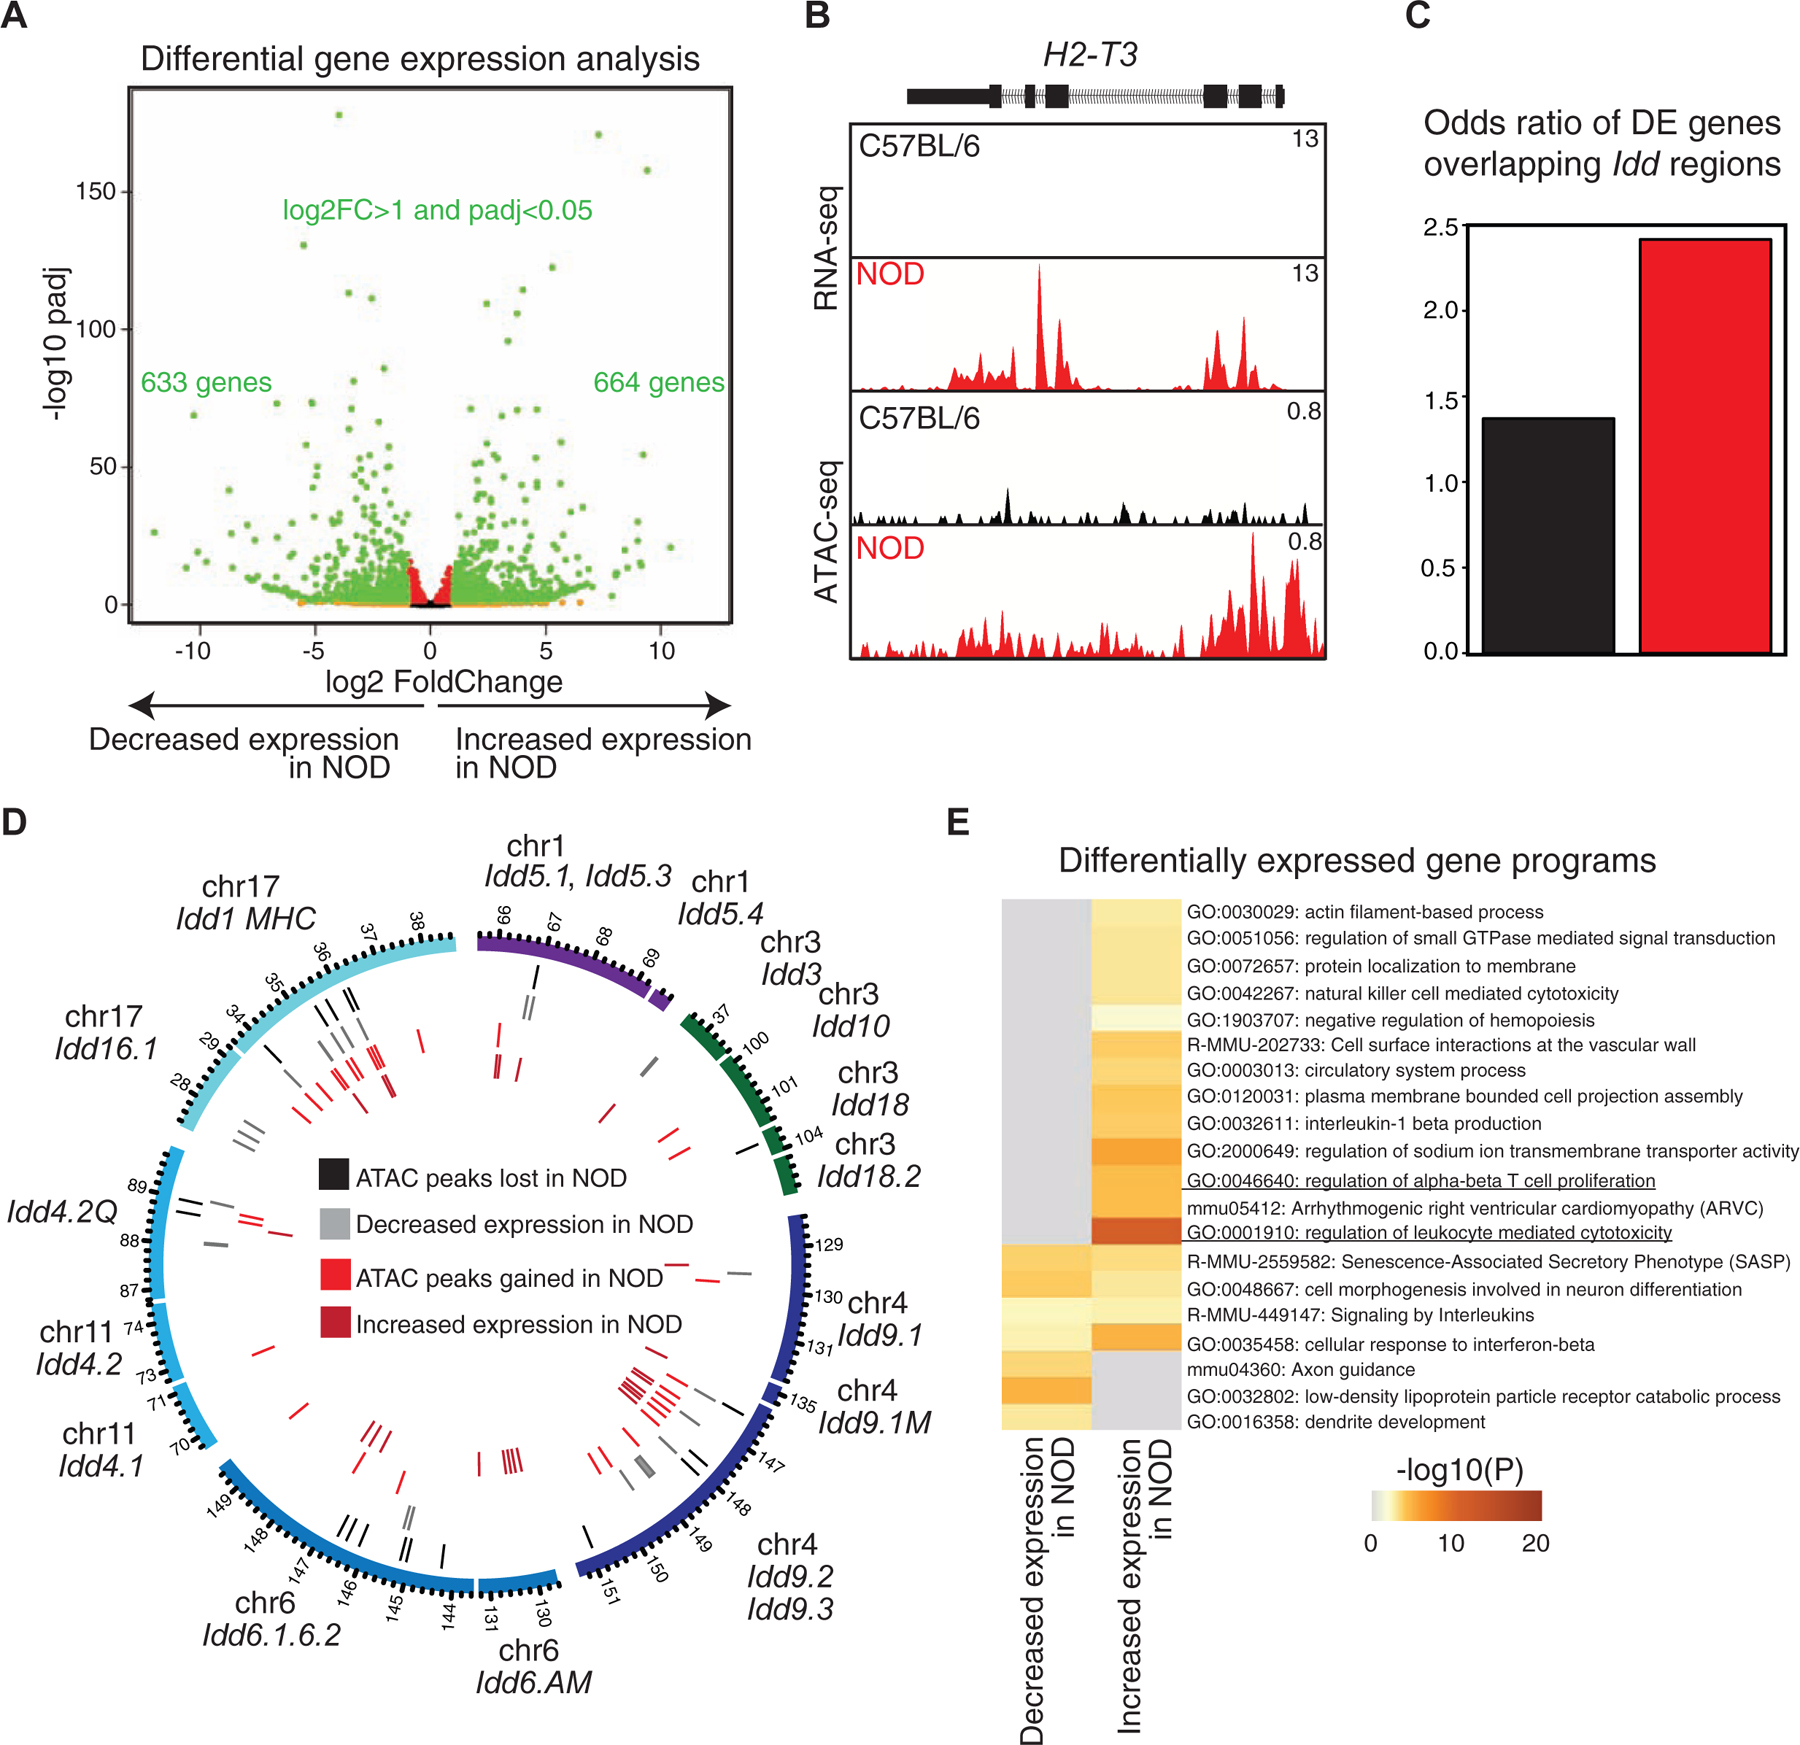
(A) Volcano plot demonstrates differential expression analysis by DESeq2 using two biological and two technical RNA-seq replicates in double-positive thymocytes in C57BL/6 and NOD mice (log2FoldChange>1 and padj<0.05).
(B) ATAC-seq and RNA-seq profiles at H2–T3 demonstrate the association between gain in accessibility of a promoter with transcription in NOD mice.
(C) A higher odds ratio is associated with Idd regions overlapping with genes with increased expression in NOD mice compared with genes demonstrating decreased expression in this strain. Contingency table was calculated based on counts of differentially expressed genes between strains overlapping Idd regions in comparison with strain-similar genes.
(D) Circos plot demonstrates 18 Idd intervals together with genomic locations of differentially accessible regions and differentially expressed genes in NOD mice in comparison with C57BL/6.
(E) Gene ontology analysis for differentially expressed genes using metascape suggests the ‘regulation of leukocyte mediated cytotoxicity’ associated genes to be enriched at NOD expressed genes.