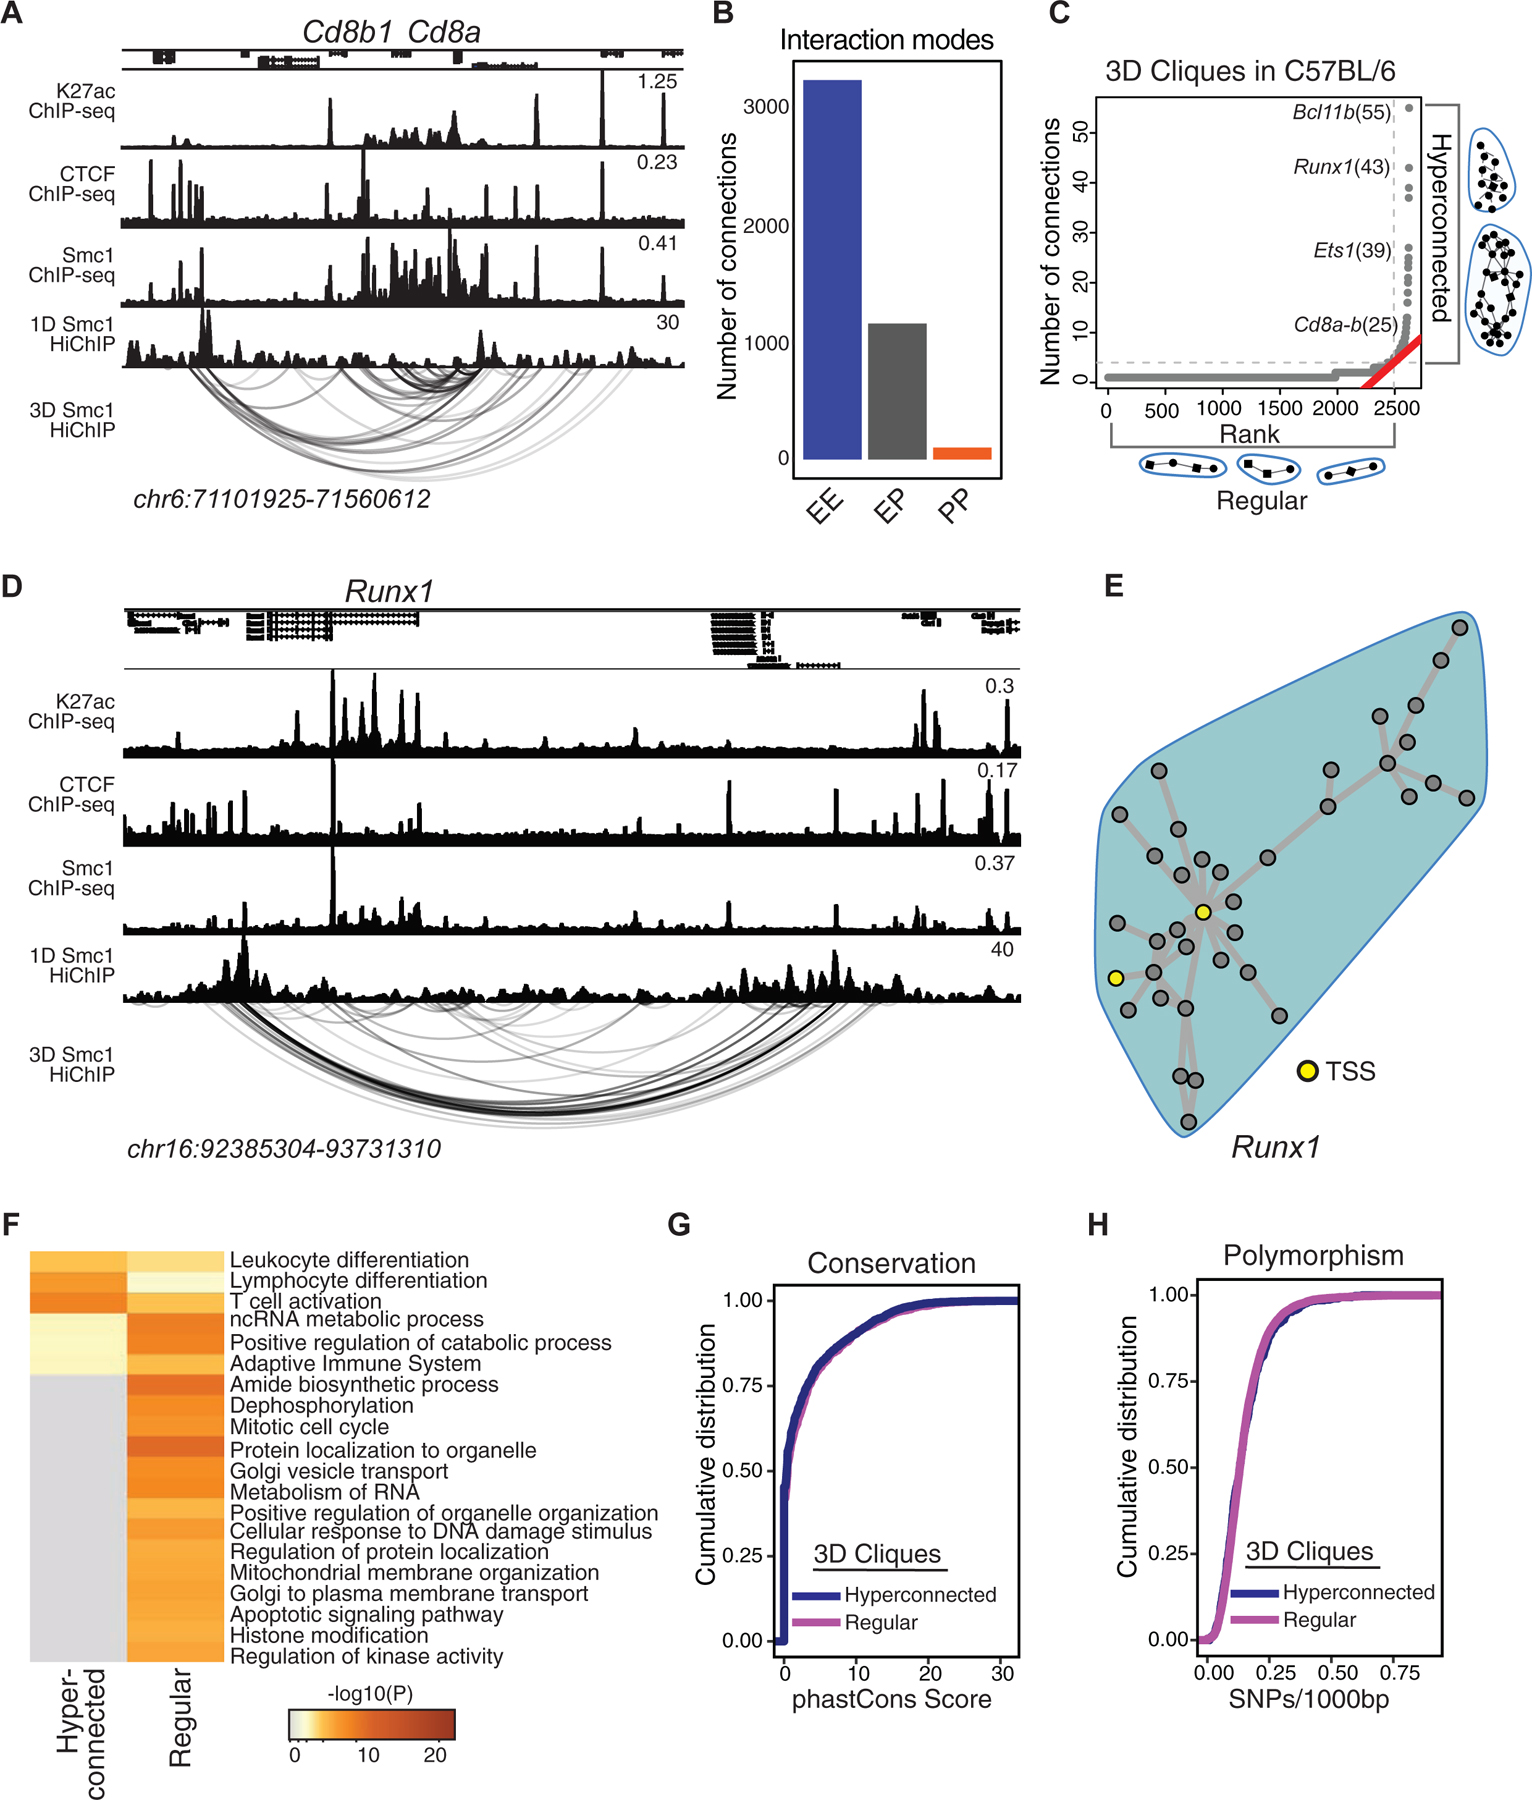
Figure 3. Genes with prominent roles in T cell development are enriched at hyperconnected 3D cliques of C57BL/6.

(A) The genome browser view demonstrates H3K27ac, CTCF, and Smc1 ChIP-seq and Smc1 HiChIP 1D and 3D interactions at the Cd8a-Cd8b1 locus. Smc1 HiChIP measurements in two biological replicates were generated and only reproducible interactions were used for further analysis.
(B) The number of enhancer-enhancer (EE), enhancer-promoter (EP), and promoter-promoter (PP) interactions in DP T cells measured by Smc1 HiChIP interactions reproduced in two replicates in C57BL/6 mice. Enhancers were defined by deposition of H3K27ac.
(C) 3D clique total connectivity in C57BL/6 reveals two classes of interacting enhancers and promoters. Cliques are plotted in an ascending order of their total connectivity. Hyperconnected 3D cliques are defined as the ones above the elbow of the total connectivity ranking. Example of hyperconnected 3D cliques are marked and named with their representative genes. Number of interactions in each clique is provided in parenthesis.
(D-E) The genome-browser view and network topology of a hyperconnected 3D clique at the Runx1 gene.
(F) Gene ontology analysis using metascape suggests ‘leukocyte differentiation’, ‘T cell activation’ and ‘lymphocyte differentiation’ are associated with hyperconnected 3D cliques.
(G-H) Cumulative distribution function for number of SNPs between C57BL/6 and NOD per 1000 base-pair (G) and sequence conservation (H) at enhancers within hyperconnected or regular 3D cliques.
