
Figure 4. Comparable epigenetic signature at shared hyperconnected 3D cliques.
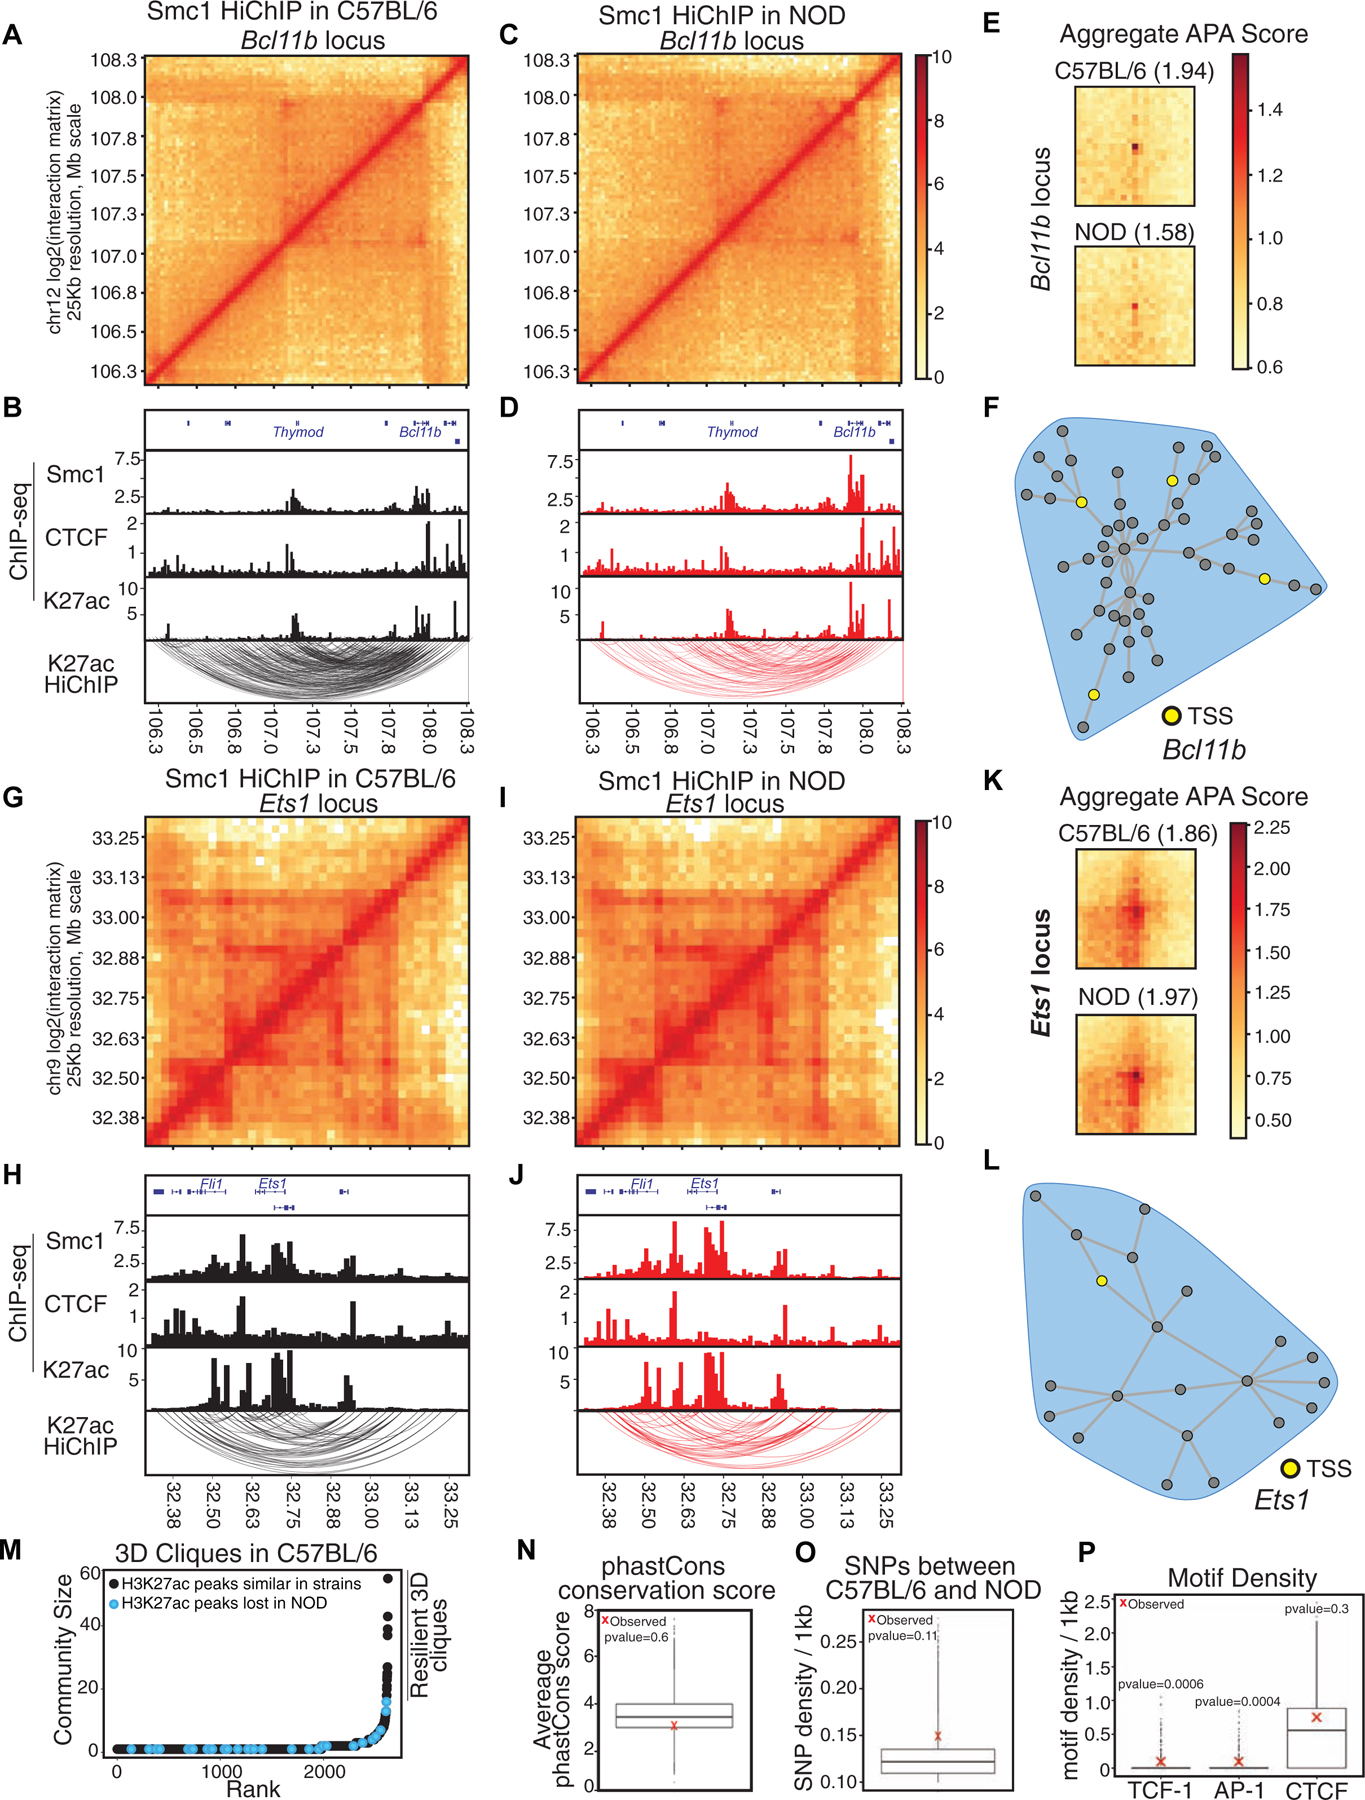
(A-L) Contact matrices based on Smc1 HiChIP for regions harboring T cell development genes Bcl11b (A, C) and Ets1 (G, I). Genome browser views of Smc1, CTCF, H3K27ac ChIP-seq and reproducible significant loops from H3K27ac HiChIP for Bcl11b (B, D) and Ets1 (H, J) in both strains. (E, K) Aggregate peak analysis (APA) was used to measure the strength of the Smc1 HiChIP loops in contact matrices from both strains in Bcl11b (E) and Ets1 regions (K).
(M) Hockey plot demonstrates 3D clique analysis for Smc1 HiChIP in C57BL/6 mice. 3D cliques harboring at least one enhancer with loss of accessibility in NOD mice (i.e. being selectively acetylated (H3K27ac) in C57BL/6) are marked in black. The top hyperconnected 3D cliques harboring only strain-similar enhancers are marked as ‘resilient 3D cliques’.
(N-O) Boxplot represents the average phastCons score (N) and distribution of SNPs per 1kbp (O) at nodes of 100,000 permuted hyperconnected 3D cliques. Red X represents the average SNPs per 1kbp at nodes of 17 resilient hyperconnected 3D cliques.
(P) Boxplot represents the distribution of TCF, AP-1 and CTCF motif density per 1kbp at nodes of 100,000 permuted hyperconnected 3D cliques. Red X represents the average density of TCF, AP-1 and CTCF motif per 1kbp at nodes of resilient hyperconnected 3D cliques.