Figure 5.

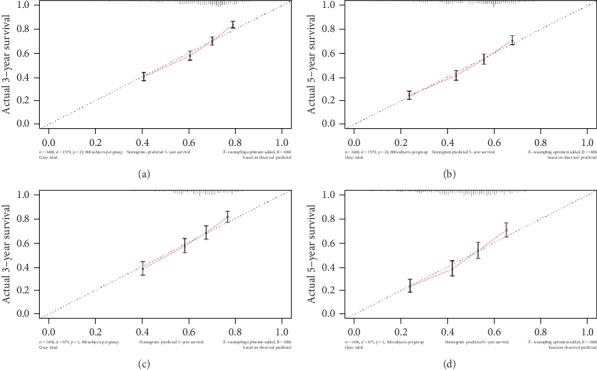
Calibration plot of the nomogram in the derivation cohort and validation cohort. The x-axis is the predicted survival calculated by the nomogram, and the y-axis is the actual survival estimated by the Kaplan-Meier method.

Calibration plot of the nomogram in the derivation cohort and validation cohort. The x-axis is the predicted survival calculated by the nomogram, and the y-axis is the actual survival estimated by the Kaplan-Meier method.