Figure 3.

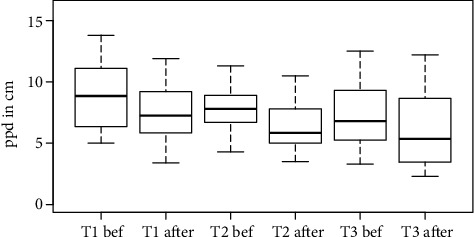
The proporioceptive drift (ppd) in cm for time points T1-T3 before and after the rubber hand illusion. The data is a mean of all participants.

The proporioceptive drift (ppd) in cm for time points T1-T3 before and after the rubber hand illusion. The data is a mean of all participants.