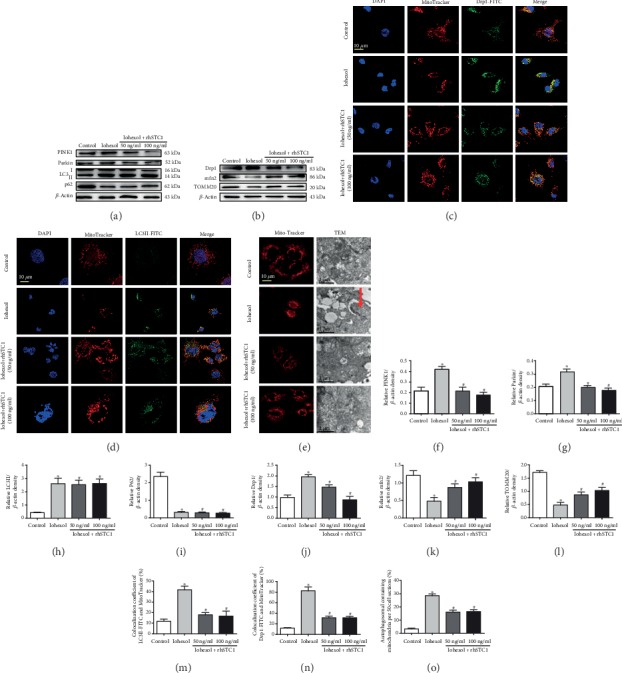
Figure 3.

rhSTC1 treatment reduces mitochondrial damage and mitophagy in HK-2 cells after iohexol exposure. (a, b) Western blot analysis of the expression of mitophagy and mitophagy-related protein (n = 3). Cells were treated with iohexol (200 mg I/ml) with or without rhSTC1 (50 ng/ml, 100 ng/ml) at an indicated time course, and then the whole cell lysates were collected for Western blot analysis. (c, d) Representative images. HK-2 cells were exposed to iohexol (200 mg iodine/ml) with or without rhSTC1 (50 ng/ml, 100 ng/ml) for 4 hours and then were treated with LC3II-FITC or Drp1-FITC (green) and MitoTracker (red), respectively (n = 3). The distribution of LC3II-FITC, Drp1-FITC, and MitoTracker was analyzed by a confocal microscope. Colocalization of LC3II-FITC or Drp1-FITC and MitoTracker was presented as overlapped red and green peaks. (e) Representative images. HK-2 cells were exposed to iohexol (200 mg iodine/ml) with or without rhSTC1 (50 ng/ml, 100 ng/ml) for 4 hours and then were treated with MitoTracker (red) to label mitochondria (n = 3) or collected for electron micrograph analysis. Mitophagy was labeled with red arrow. (f–l) Quantification of average Western blot band intensities. (m, n) Semiquantitative fluorescence analysis. (o) Semiquantitative analysis of number of mitophagy. Values were presented as mean ± SE (n = 3), and n = 3 referred to number of replicates. ∗p < 0.05, compared with the control group. #p < 0.05, compared with the iohexol group.
