
Figure 2.
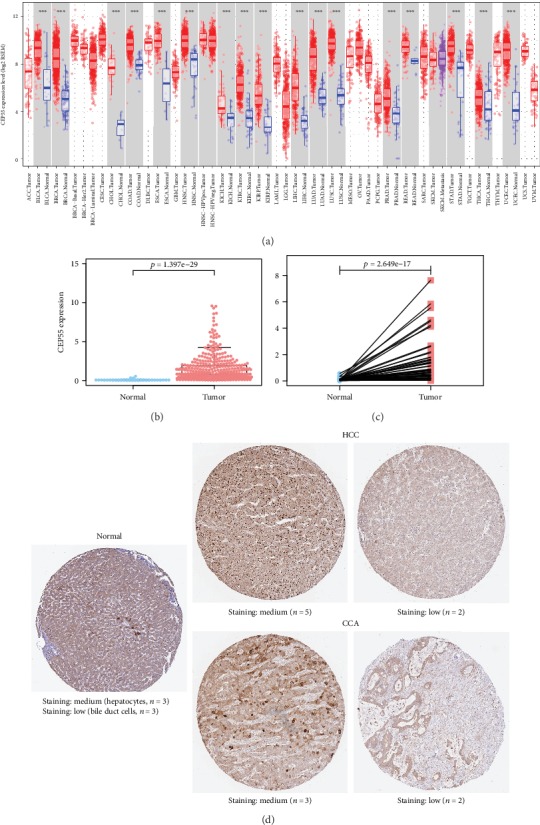
CEP55 expression both in the mRNA and protein levels. (a) Overview of CEP55 mRNA expression in different tumor tissues and adjacent normal tissues via the TIMER database (∗∗∗p < 0.001). (b) Comparison of CEP55 expression between liver cancer tissues and adjacent normal liver tissues. (c) Expression of CEP55 in 58 paired liver cancer tissues and adjacent normal tissues. (d) Representative IHC images of CEP55 in normal liver tissues and liver cancer tissues from the HPA database. TIMER: Tumor Immune Estimation Resource; HPA: Human Protein Atlas.