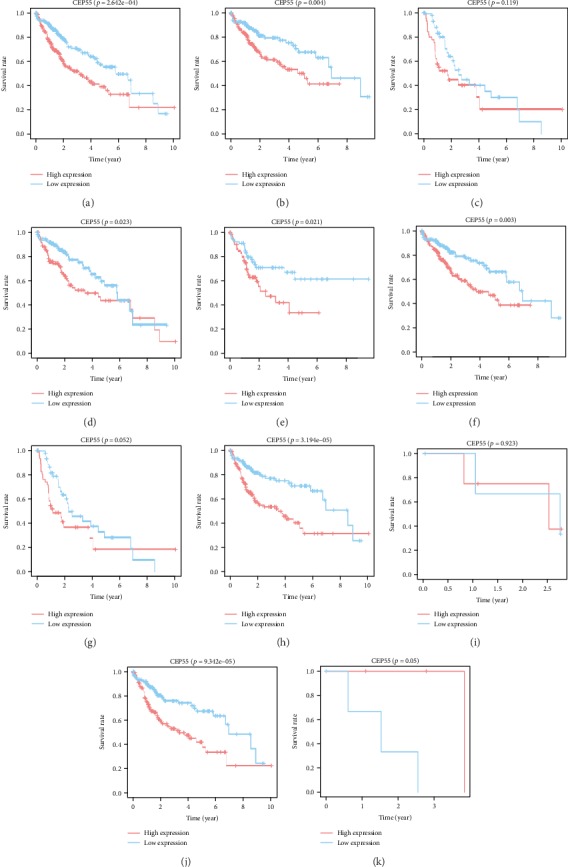
Figure 4.

Survival analysis of all liver cancer patients (a) and subgroup analysis based on clinical stage (stage I/II and stage III/VI) (b, c), histological grade (G1/2 and G3/4) (d, e), and TNM classification (T1/2, T3/4, N0, N1, M0, M1) (f–k). Red curve indicates high CEP55 expression; blue curve indicates low CEP55 expression.
