
Figure 2. Associations (β and 95% confidence intervals) between individual metals at baseline and BMI at follow-up.
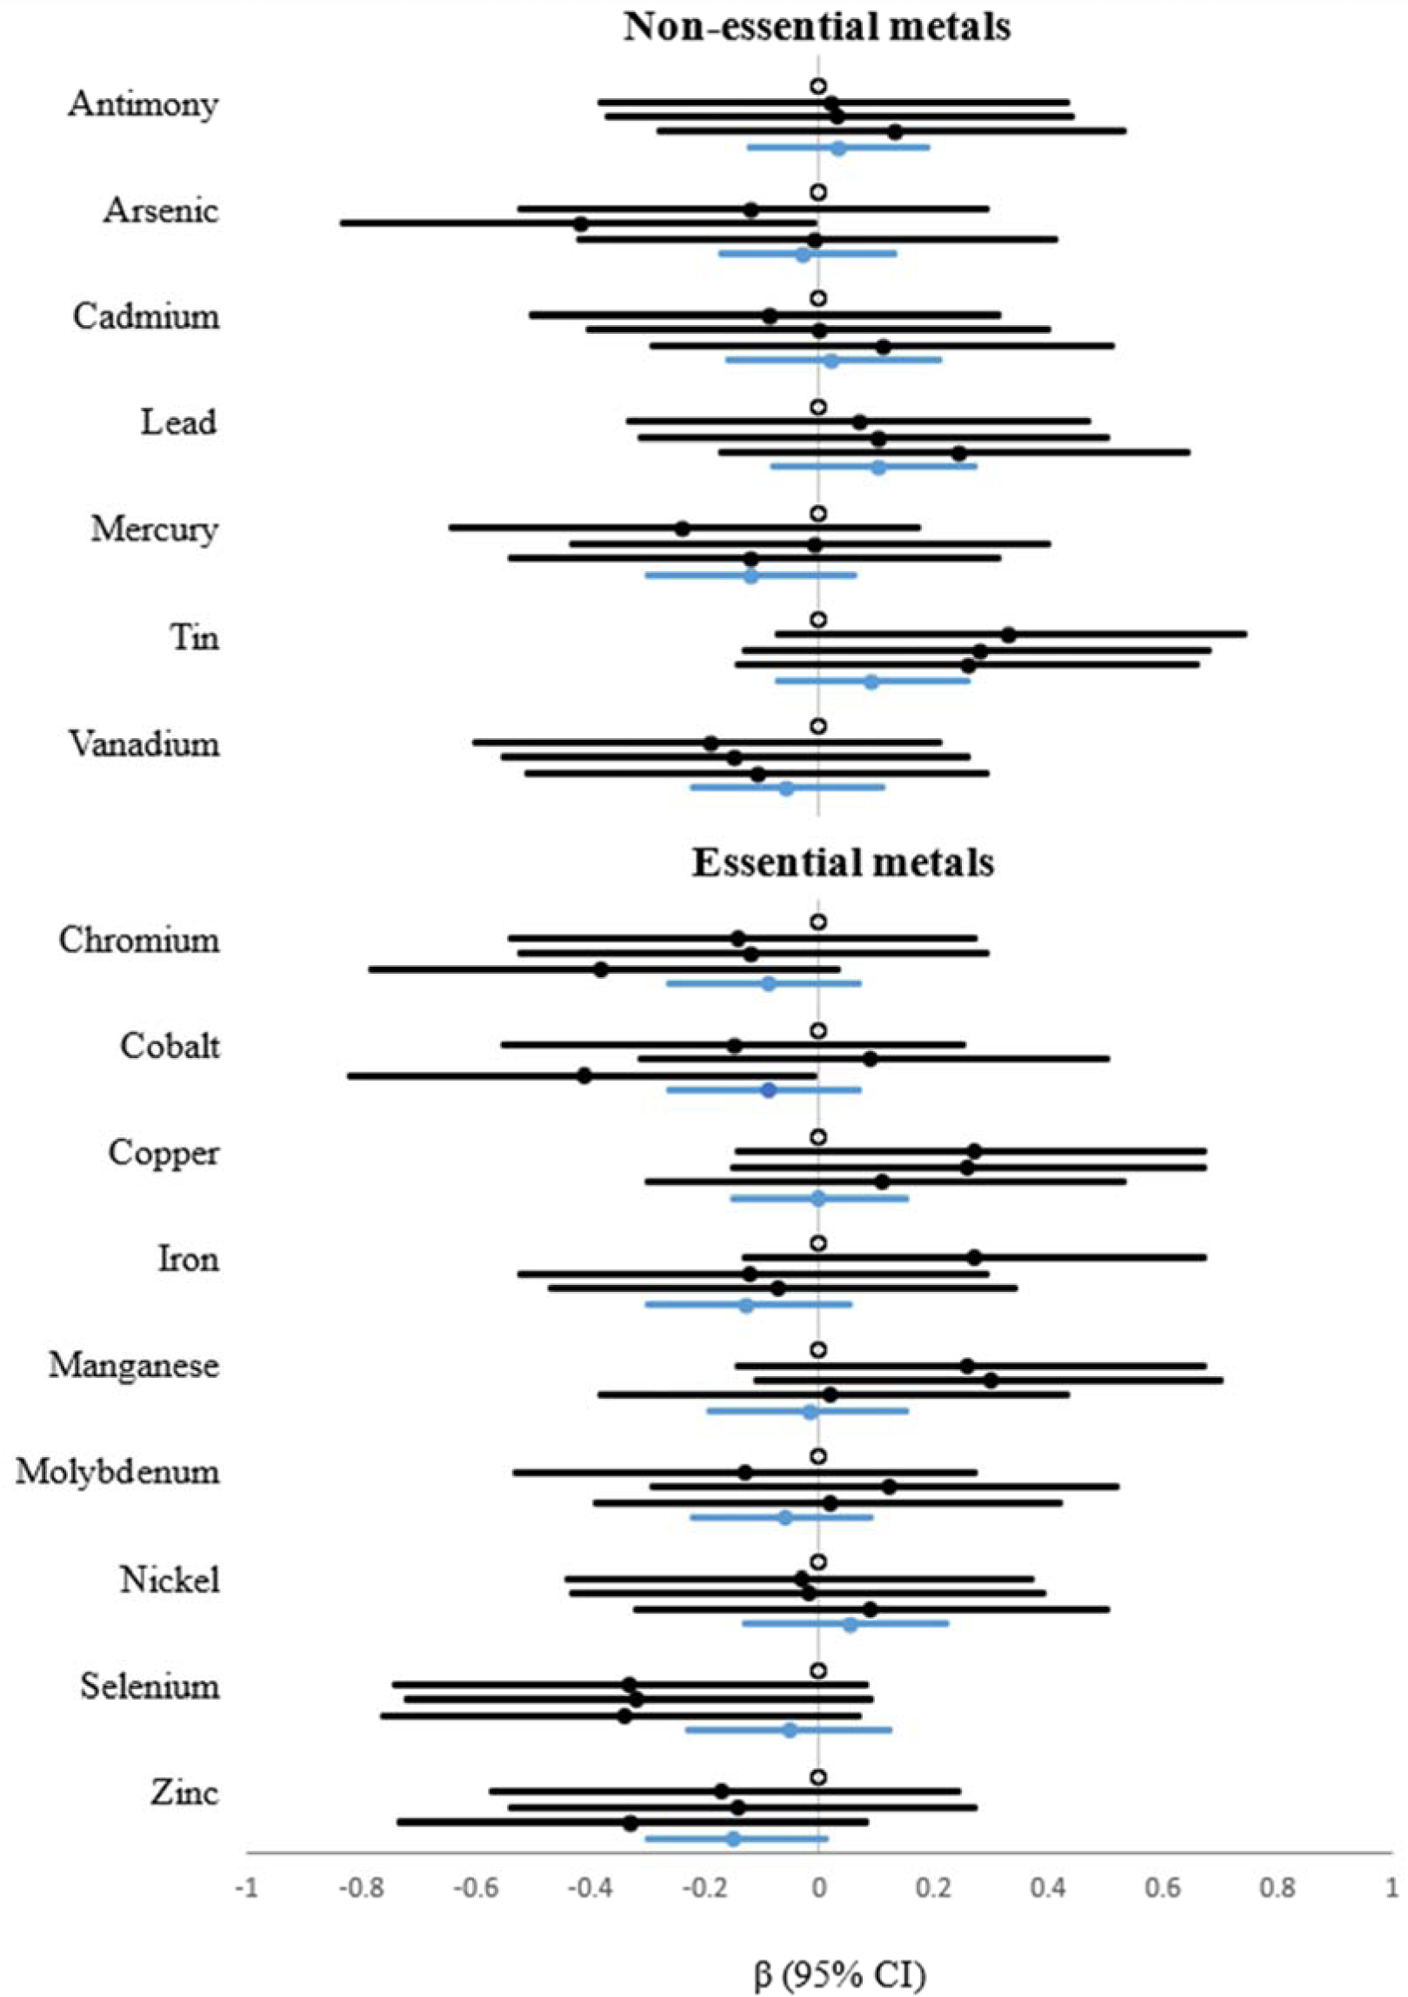
Black, filled circles and bars represent the association for each quartile above the referent (unfilled circle); blue, filled circles and bars represent the association for an interquartile range (IQR) increase in the log-transformed metal concentration.