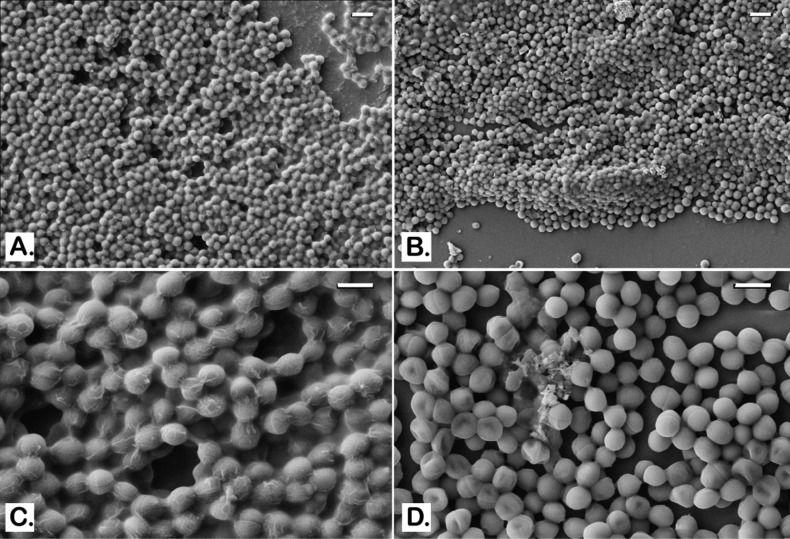
Figure 3.
SEM images of MRSA OU11 biofilms on glass coverslips. Untreated control biofilms are shown to be covered and wrapped around in the matrix of EPS (A and C). BPEI-treated samples have much less EPS with many cells being exposed (B and D). Scale bars in (A) and (B) = 2 μm. Scale bars in (C) and (D) = 1 μm.

