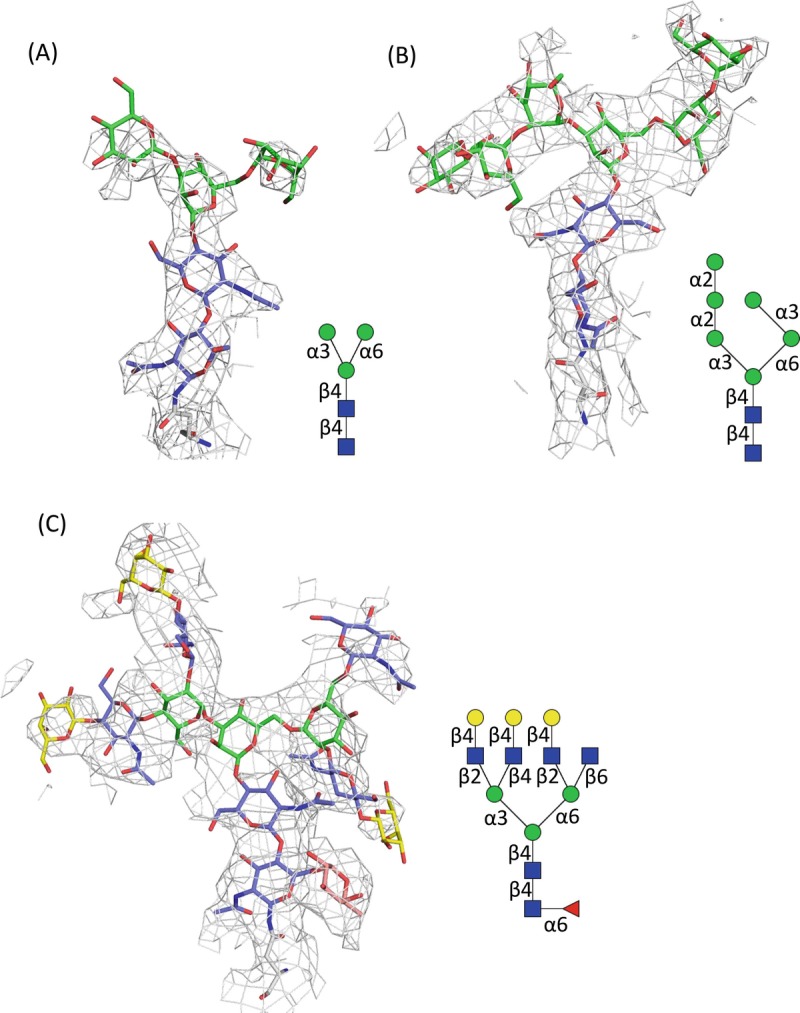
Fig. 7.8.

Electron microscopic images of carbohydrates covalently attached onto proteins
(a) N-glycan core attached onto N55 of human nicastrin, a component of γ-secretase complex ((Bai et al. 2015), PDB code: 5A63, EMDB: 3061). The density map is depicted at 5.0 σ level cutoff. Schematic representation of the observed glycan is shown in right panel
(b) High-mannose-type N-glycan attached onto N426 of human coronavirus NL63 (HCoV-NL63) ((Walls et al. 2016), PDB code, 5SZS; EMDB, 8331). The density map is contoured at 7.0 σ level
(c) Tetra-antennary glycan attached onto N637 of HIV-1 Env trimer ((Lee et al. 2016), PDB code, 5FUU; EMDB, 3308). The density map is depicted in cyan mesh contoured at 5.5 σ level
